Fortrade Canada Ltd. as an order-execution only dealer is not permitted to provide you with any advice or recommendations. These Market Commentaries should not be construed as a recommendation, advice or any attempt by Fortrade Canada Ltd. to prompt or influence you in making an investment decision to purchase, sell, hold or exchange any security or to influence the timing of such activity. This content is produced by Fortrade Limited which is not registered in any capacity with any securities regulatory authority in Canada.
69% of retail investor accounts lose money when trading CFDs with this provider.
CFDs are complex instruments and come with a high risk of losing money rapidly due to leverage. 69% of retail investor accounts lose money when trading CFDs with this provider. You should consider whether you understand how CFDs work and whether you can afford to take the high risk of losing your money.
70.88% of retail investor accounts lose money when trading CFDs with this provider.
CFDs are complex instruments and come with a high risk of losing money rapidly due to leverage. 70.88% of retail investor accounts lose money when trading CFDs with this provider. You should consider whether you understand how CFDs work and whether you can afford to take the high risk of losing all your money. Read full risk warning.
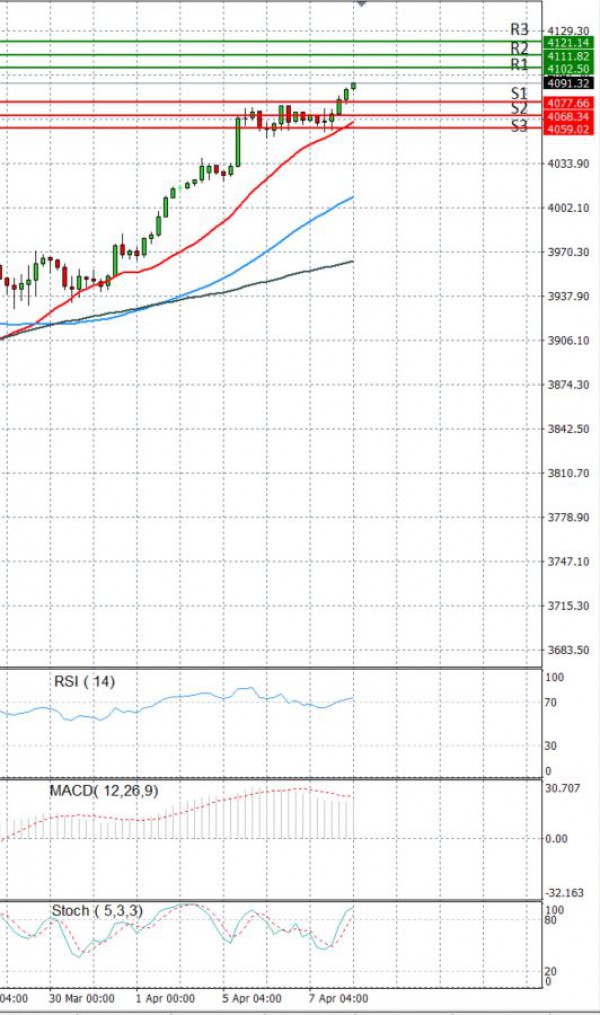
EU Session Analysis for CFD Instruments 08/04/2021
Fundamental analysis
08 April, 2021
Major averages hovered near unchanged on Wednesday, with the S&P closing up slightly after the Federal Reserve released minutes from its most recent meeting that reinforced the U.S. central bank’s position to remain patient before raising rates. The major indexes held near unchanged for most of the day but the S&P 500 briefly climbed to a session high after the minutes, in which Fed officials said it would likely take “some time” for substantial further progress on goals of maximum employment and stable prices. But the gains were minor and short-lived, as many market participants question the ability to hold off on a rate hike for as long as the Fed has stated. The yield on the benchmark 10-year U.S. Treasury note moved higher late in the session. Still, it remained below a 14-month high of 1.776% hit on March 30. The recent pullback in yields has helped growth names and lifted technology and communication services stocks on the day. The upcoming earnings season and progress in a multi trillion-dollar infrastructure proposal could decide Wall Street’s path forward. Analysts have raised expectations for first-quarter S&P 500 earnings to increase to 24.2%, according to Refinitiv IBES data as of April 1, versus 21% forecast on Feb. 5.