Fortrade Canada Ltd. as an order-execution only dealer is not permitted to provide you with any advice or recommendations. These Market Commentaries should not be construed as a recommendation, advice or any attempt by Fortrade Canada Ltd. to prompt or influence you in making an investment decision to purchase, sell, hold or exchange any security or to influence the timing of such activity. This content is produced by Fortrade Limited which is not registered in any capacity with any securities regulatory authority in Canada.
69% of retail investor accounts lose money when trading CFDs with this provider.
CFDs are complex instruments and come with a high risk of losing money rapidly due to leverage. 69% of retail investor accounts lose money when trading CFDs with this provider. You should consider whether you understand how CFDs work and whether you can afford to take the high risk of losing your money.
70.88% of retail investor accounts lose money when trading CFDs with this provider.
CFDs are complex instruments and come with a high risk of losing money rapidly due to leverage. 70.88% of retail investor accounts lose money when trading CFDs with this provider. You should consider whether you understand how CFDs work and whether you can afford to take the high risk of losing all your money. Read full risk warning.
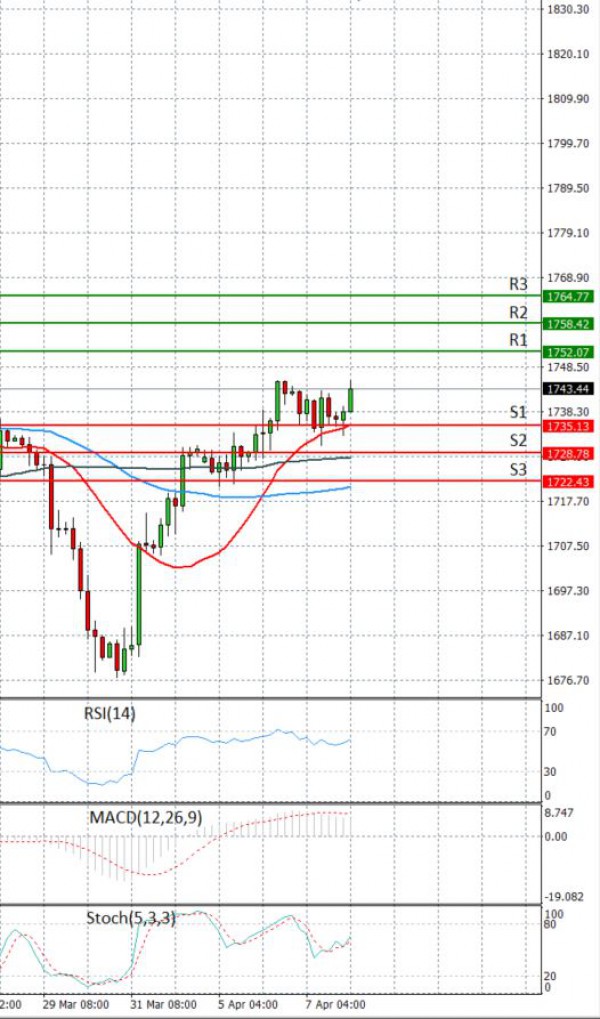
EU Session Analysis for CFD Instruments 08/04/2021
Fundamental analysis
08 April, 2021
Gold prices slipped on Thursday as investors turned to riskier assets after the U.S. Federal Reserve's latest meeting minutes indicated continued policy support and cemented hopes of a quick economic turnaround. Officials at the Federal Reserve are concerned about the ongoing risks of the COVID-19 pandemic and are committed to supporting the economy until its recovery is more stable, according to minutes of the central bank's most recent policy meeting released on Wednesday. Limiting gold's losses, the U.S. dollar traded near more than two-week troughs versus major peers on Thursday, tracking Treasury yields lower.