CFDs are complex instruments and come with a high risk of losing money rapidly due to leverage. 71% of retail investor accounts lose money when trading CFDs with this provider. You should consider whether you understand how CFDs work and whether you can afford to take the high risk of losing your money.
CFDs are complex instruments and come with a high risk of losing money rapidly due to leverage. 70.91% of retail investor accounts lose money when trading CFDs with this provider. You should consider whether you understand how CFDs work and whether you can afford to take the high risk of losing all your money. Read full risk warning.

Crude Oil Analysis

EU Session Analysis for CFD Instruments 19/04/2021

Fundamental analysis

19 April, 2021

Oil prices were lower on Monday as rising coronavirus infections in India and other countries prompted concerns that stronger measures to contain the pandemic will hit economic activity, along with demand for commodities such as crude.India reported a record rise in coronavirus infections of 273,810 on Monday, increasing overall cases to just over 15 million, making the country the second-worst affected after the United States, which has reported more than 31 million infections. India’s deaths from COVID-19 rose by a record 1,619 to nearly 180,000. Hong Kong will suspend flights from India, Pakistan and the Philippines from April 20 due to imported coronavirus infections, authorities said in a statement late on Sunday. Japanese companies believe the world’s third-largest economy will experience a fourth round of coronavirus infections, with many bracing for a further blow to business, a Reuters monthly poll showed. In the United States energy companies added oil and natural gas rigs for a fifth consecutive week for the first time since February as higher oil prices this year encouraged drillers to return to the wellpad.
Technical analysis

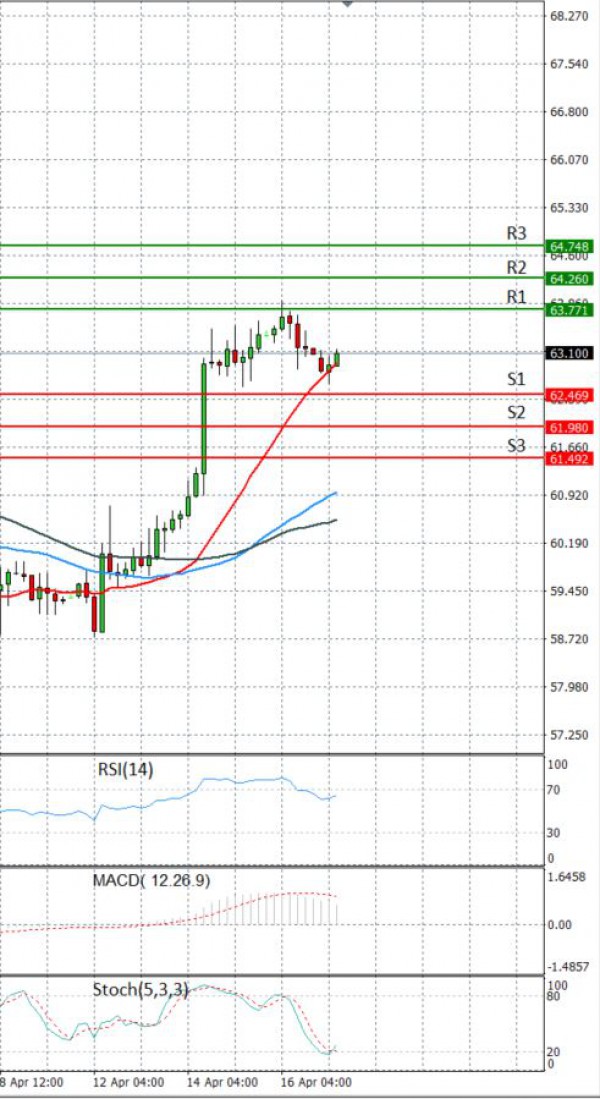
Crude Oil Analysis Technical analysis 19/04/2021
Time Frame: 1 hour

CRUDEOIL Support & Resistance Table - 19/04/2021

Support & Resistance Level Explanation
Resistance 2 64.260 Daily R2
Resistance 1 63.771 Daily R1
Support 1 62.469 Daily S1
Support 2 61.980 Daily S2

CRUDEOIL Indicator Table - 19/04/2021

Indicator Signal
SMA 20 Neutral
SMA 50 Buy
SMA 100 Buy
MACD( 12;26;9) Buy
RSI (14) Buy
Stochastic ( 9;6;3) Sell

CRUDEOIL Indicator / Period Table - 19/04/2021

Indicator / Period Day - BuyWeek - BuyMonth - Buy
MACD( 12;26;9) Buy SellBuy
RSI (14) Buy BuyBuy
SMA 20 Neutral BuyBuy

CRUDEOIL 19/04/2021 - Reference Price : 63.120

Buy
Simple Moving AverageBuy (2)Sell (0)
Technical Indicators - OscillatorsBuy (3)Sell (2)
Share It With Your Network
Crude OIL Chart
Update Time: -
Highest
Lowest
1M 5M H D W
Prices are loading..
Ready for trading?Start Now