Fortrade Canada Ltd. as an order-execution only dealer is not permitted to provide you with any advice or recommendations. These Market Commentaries should not be construed as a recommendation, advice or any attempt by Fortrade Canada Ltd. to prompt or influence you in making an investment decision to purchase, sell, hold or exchange any security or to influence the timing of such activity. This content is produced by Fortrade Limited which is not registered in any capacity with any securities regulatory authority in Canada.
71% of retail investor accounts lose money when trading CFDs with this provider.
CFDs are complex instruments and come with a high risk of losing money rapidly due to leverage. 71% of retail investor accounts lose money when trading CFDs with this provider. You should consider whether you understand how CFDs work and whether you can afford to take the high risk of losing your money.
70.91% of retail investor accounts lose money when trading CFDs with this provider.
CFDs are complex instruments and come with a high risk of losing money rapidly due to leverage. 70.91% of retail investor accounts lose money when trading CFDs with this provider. You should consider whether you understand how CFDs work and whether you can afford to take the high risk of losing all your money. Read full risk warning.
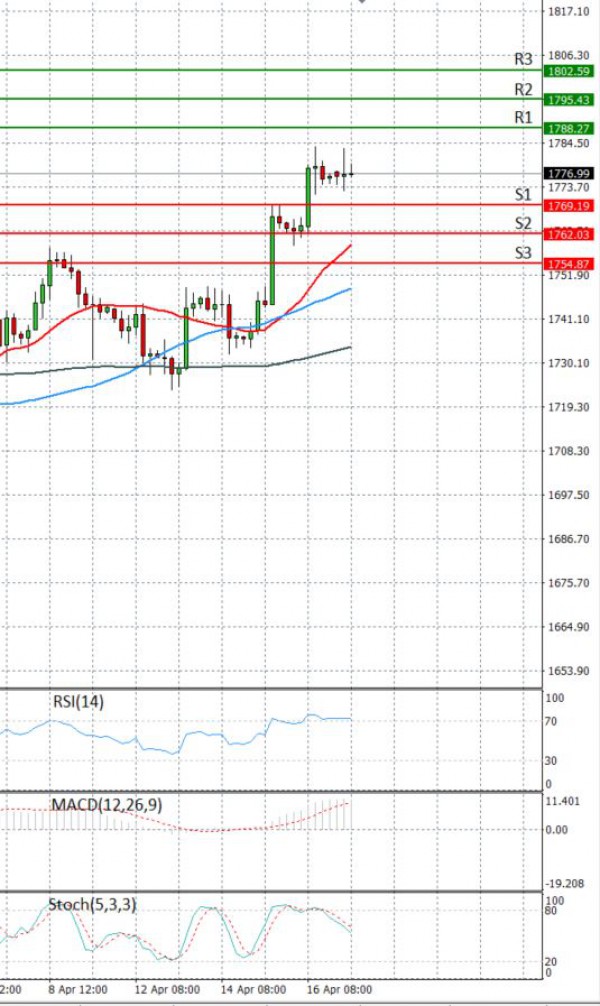
EU Session Analysis for CFD Instruments 19/04/2021
Fundamental analysis
19 April, 2021
Gold edged higher on Monday, hovering near a seven-week peak hit in the previous session, as a weaker dollar and lower U.S. Treasury yields supported prices. The dollar index was languishing near a one-month low against its rivals, making gold less expensive for other currency holders. Benchmark U.S. 10-year Treasury yields edged lower towards multi-weeks low touched last week. Lower bond yields reduce the opportunity cost of holding non-interest bearing gold. Gold prices continued their ascent on Friday as long term U.S. treasury yields dropped. It was also reported that the Chinese government has increased the amount of gold its banks and financial institutions could import. It was also noted that Chinese banks bought $8.5 billion worth of gold in March and April, taking advantage of their new privileges.