Fortrade Canada Ltd. as an order-execution only dealer is not permitted to provide you with any advice or recommendations. These Market Commentaries should not be construed as a recommendation, advice or any attempt by Fortrade Canada Ltd. to prompt or influence you in making an investment decision to purchase, sell, hold or exchange any security or to influence the timing of such activity. This content is produced by Fortrade Limited which is not registered in any capacity with any securities regulatory authority in Canada.
71% of retail investor accounts lose money when trading CFDs with this provider.
CFDs are complex instruments and come with a high risk of losing money rapidly due to leverage. 71% of retail investor accounts lose money when trading CFDs with this provider. You should consider whether you understand how CFDs work and whether you can afford to take the high risk of losing your money.
70.91% of retail investor accounts lose money when trading CFDs with this provider.
CFDs are complex instruments and come with a high risk of losing money rapidly due to leverage. 70.91% of retail investor accounts lose money when trading CFDs with this provider. You should consider whether you understand how CFDs work and whether you can afford to take the high risk of losing all your money. Read full risk warning.
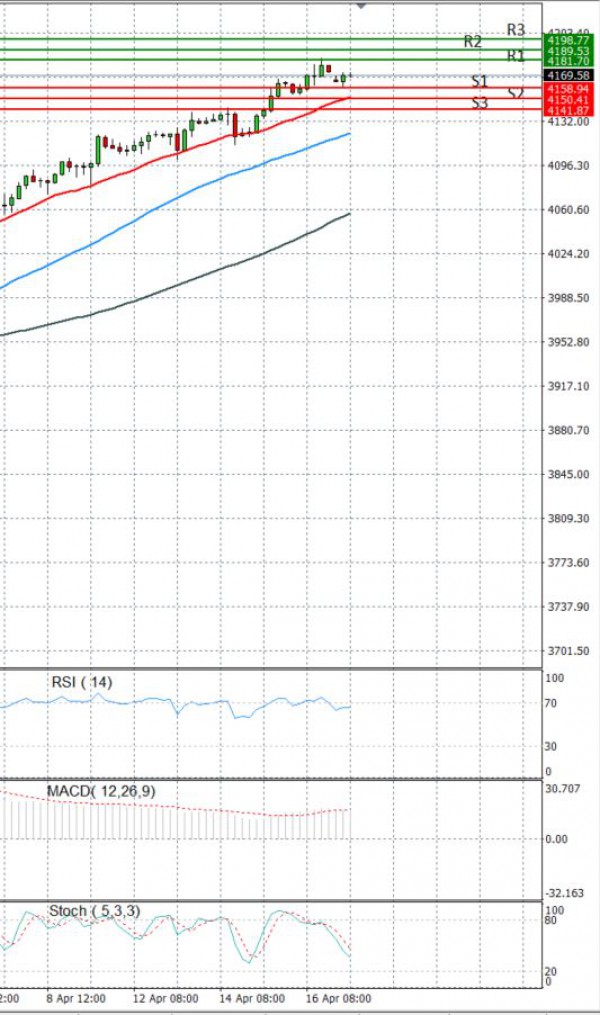
EU Session Analysis for CFD Instruments 19/04/2021
Fundamental analysis
19 April, 2021
The three main Wall Street indexes ended Friday higher for the day and week, with the S&P 500 and the Dow breaking closing records, as investors took strong economic data and bank earnings as signs of momentum in the U.S. pandemic rebound.The S&P 500 and the blue-chip Dow Jones Industrial Average recorded their fourth straight week of gains, while the technology-heavy Nasdaq finished less than one percent below its own all-time closing high achieved on Feb. 12. Further buoyant bank earnings came on Friday from Morgan Stanley, which reported a 150% jump in quarterly profit, joining JPMorgan Chase & Co, Goldman Sachs Group Inc and Bank of America in reinforcing hopes of a swift economic recovery.The Federal Reserve’s pledge to keep interest rates low despite higher inflation has also revived demand for richly valued technology stocks, although bond yields edged higher again on Friday after hitting multi-week lows a day earlier.