CFDs are complex instruments and come with a high risk of losing money rapidly due to leverage. 71% of retail investor accounts lose money when trading CFDs with this provider. You should consider whether you understand how CFDs work and whether you can afford to take the high risk of losing your money.
CFDs are complex instruments and come with a high risk of losing money rapidly due to leverage. 70.91% of retail investor accounts lose money when trading CFDs with this provider. You should consider whether you understand how CFDs work and whether you can afford to take the high risk of losing all your money. Read full risk warning.

Crude Oil Analysis

EU Session Analysis for CFD Instruments 24/09/2021

Fundamental analysis

24 September, 2021

Oil prices rose on Friday for a fourth straight day due to global supply concerns following powerful storms in the United States, with China’s first public sale of state crude reserves causing a momentary blip in the rise. Oil companies in the United States have struggled to fully restore deliveries to the eastern seaboard after storms damaged facilities on the Gulf coast. In a sign of strengthening fuel demand, capacity utilization rates at U.S. East Coast refineries increased to 93%, the highest since May 2019, Energy Information Administration (EIA) data showed. Inventories fell to the lowest in almost three years after damage from two hurricanes kept draws elevated in the United States, EIA data earlier in the week showed. Prices declined briefly on Friday after China’s first public sale of state reserves. State-owned PetroChina and private refiner and chemical producer Hengli Petrochemical bought four cargoes totalling about 4.43 million barrels, sources with direct knowledge of the auction said. Some members of the Organization of the Petroleum Exporting Countries (OPEC) and allies, known as OPEC+, have also struggled to raise output following under-investment or delays to maintenance work during the pandemic that began last year.
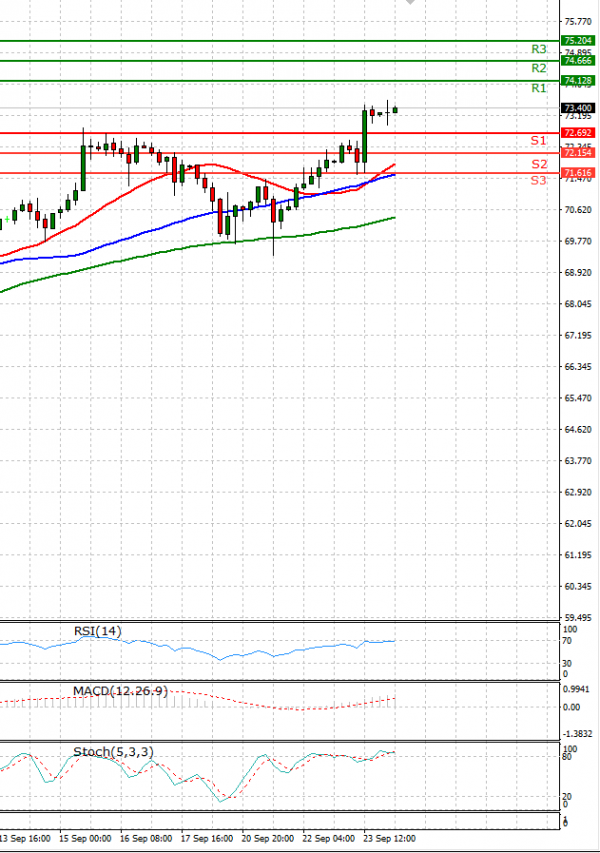
Technical analysis

Crude Oil Analysis Technical analysis 24/09/2021
Time Frame: 1 hour

CRUDEOIL Support & Resistance Table - 24/09/2021

Support & Resistance Level Explanation
Resistance 2 74.666 Daily R2
Resistance 1 74.128 Daily R1
Support 1 72.692 Daily S1
Support 2 72.154 Daily S2

CRUDEOIL Indicator Table - 24/09/2021

Indicator Signal
SMA 20 Buy
SMA 50 Buy
SMA 100 Buy
MACD( 12;26;9) Buy
RSI (14) Buy
Stochastic ( 9;6;3) Buy

CRUDEOIL Indicator / Period Table - 24/09/2021

Indicator / Period Day - BuyWeek - BuyMonth - Buy
MACD( 12;26;9) Buy BuyBuy
RSI (14) Buy BuyBuy
SMA 20 Buy BuyBuy

CRUDEOIL 24/09/2021 - Reference Price : 73.410

Buy
Simple Moving AverageBuy (3)Sell (0)
Technical Indicators - OscillatorsBuy (3)Sell (0)
Share It With Your Network
Crude OIL Chart
Update Time: -
Highest
Lowest
1M 5M H D W
Prices are loading..
Ready for trading?Start Now