Fortrade Canada Ltd. as an order-execution only dealer is not permitted to provide you with any advice or recommendations. These Market Commentaries should not be construed as a recommendation, advice or any attempt by Fortrade Canada Ltd. to prompt or influence you in making an investment decision to purchase, sell, hold or exchange any security or to influence the timing of such activity. This content is produced by Fortrade Limited which is not registered in any capacity with any securities regulatory authority in Canada.
69% of retail investor accounts lose money when trading CFDs with this provider.
CFDs are complex instruments and come with a high risk of losing money rapidly due to leverage. 69% of retail investor accounts lose money when trading CFDs with this provider. You should consider whether you understand how CFDs work and whether you can afford to take the high risk of losing your money.
70.88% of retail investor accounts lose money when trading CFDs with this provider.
CFDs are complex instruments and come with a high risk of losing money rapidly due to leverage. 70.88% of retail investor accounts lose money when trading CFDs with this provider. You should consider whether you understand how CFDs work and whether you can afford to take the high risk of losing all your money. Read full risk warning.
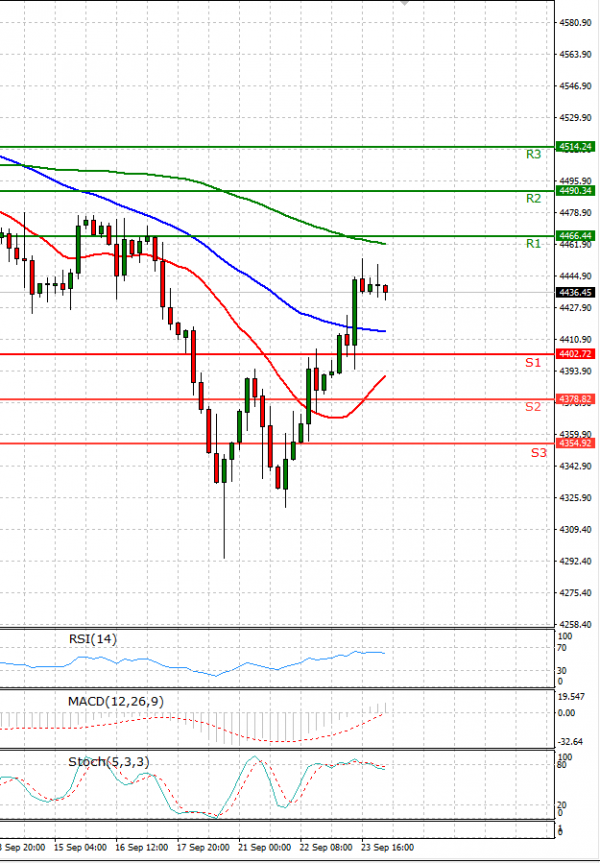
EU Session Analysis for CFD Instruments 24/09/2021
Fundamental analysis
24 September, 2021
U.S. stocks closed higher on Thursday as investors appeared relieved about the Federal Reserve’s stance on tapering stimulus and raising interest rates. Upbeat outlooks from Accenture and Salesforce helped to bolster the market, while the U.S. Food and Drug Administration late Wednesday authorized a booster dose of the Pfizer-BioNTech COVID-19 vaccine for those 65 and older. Also helping sentiment, concern about a ripple effect from China Evergrande continued to ease. The Fed said on Wednesday it could begin reducing its monthly bond purchases by as soon as November, and that interest rates could rise quicker than expected by next year. The November deadline was largely priced in by markets. Investors shrugged off data showing sluggish business activity growth and a rise in jobless claims, in line with expectations for a slowdown in economic growth in the third quarter.