CFDs are complex instruments and come with a high risk of losing money rapidly due to leverage. 71% of retail investor accounts lose money when trading CFDs with this provider. You should consider whether you understand how CFDs work and whether you can afford to take the high risk of losing your money.
CFDs are complex instruments and come with a high risk of losing money rapidly due to leverage. 70.91% of retail investor accounts lose money when trading CFDs with this provider. You should consider whether you understand how CFDs work and whether you can afford to take the high risk of losing all your money. Read full risk warning.

Crude Oil Analysis

EU Session Analysis for CFD Instruments 29/09/2021

Fundamental analysis

29 September, 2021

Oil prices fell for the second straight day on Wednesday as doubts re-emerged over demand, with COVID-19 cases continuing to rise worldwide and gasoline shortages in some regions. Oil prices have been charging higher as economies recover from pandemic lockdowns and fuel demand picks up, while some producing countries have seen supply disruptions. Traders expect Organization of the Petroleum Exporting Countries (OPEC) and allies, usually known as OPEC+, will decide to keep supplies tight when they meet next week. Oil demand is expected to rise strongly in the next few years, OPEC forecast on Tuesday, sounding a warning that the world needs to keep investing in production to avert a crunch even as it transitions to less polluting forms of energy. China’s weakening housing market and growing power outages have hit sentiment as any fallout for the world’s second-biggest economy would likely have a knock-on effect on oil demand, analysts said. Crude stocks rose by 4.1 million barrels for the week ended Sept. 24. Gasoline inventories rose by 3.6 million barrels and distillate stocks rose by 2.5 million barrels, the data showed.
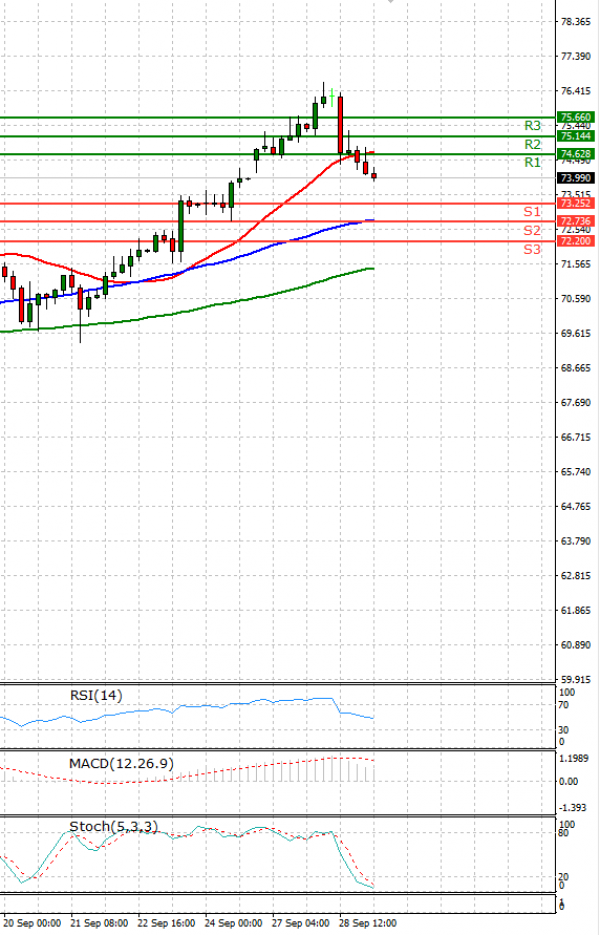
Technical analysis

Crude Oil Analysis Technical analysis 29/09/2021
Time Frame: 1 hour

CRUDEOIL Support & Resistance Table - 29/09/2021

Support & Resistance Level Explanation
Resistance 2 75.144 Daily R2
Resistance 1 74.628 Daily R1
Support 1 73.252 Daily S1
Support 2 72.736 Daily S2

CRUDEOIL Indicator Table - 29/09/2021

Indicator Signal
SMA 20 Sell
SMA 50 Buy
SMA 100 Buy
MACD( 12;26;9) Buy
RSI (14) Sell
Stochastic ( 9;6;3) Sell

CRUDEOIL Indicator / Period Table - 29/09/2021

Indicator / Period Day - SellWeek - BuyMonth - Buy
MACD( 12;26;9) Buy BuyBuy
RSI (14) Sell BuyBuy
SMA 20 Sell BuyBuy

CRUDEOIL 29/09/2021 - Reference Price : 73.940

Sell
Simple Moving AverageBuy (2)Sell (1)
Technical Indicators - OscillatorsBuy (1)Sell (2)
Share It With Your Network
Crude OIL Chart
Update Time: -
Highest
Lowest
1M 5M H D W
Prices are loading..
Ready for trading?Start Now