Fortrade Canada Ltd. as an order-execution only dealer is not permitted to provide you with any advice or recommendations. These Market Commentaries should not be construed as a recommendation, advice or any attempt by Fortrade Canada Ltd. to prompt or influence you in making an investment decision to purchase, sell, hold or exchange any security or to influence the timing of such activity. This content is produced by Fortrade Limited which is not registered in any capacity with any securities regulatory authority in Canada.
69% of retail investor accounts lose money when trading CFDs with this provider.
CFDs are complex instruments and come with a high risk of losing money rapidly due to leverage. 69% of retail investor accounts lose money when trading CFDs with this provider. You should consider whether you understand how CFDs work and whether you can afford to take the high risk of losing your money.
67.52% of retail investor accounts lose money when trading CFDs with this provider.
CFDs are complex instruments and come with a high risk of losing money rapidly due to leverage. 67.52% of retail investor accounts lose money when trading CFDs with this provider. You should consider whether you understand how CFDs work and whether you can afford to take the high risk of losing all your money. Read full risk warning.
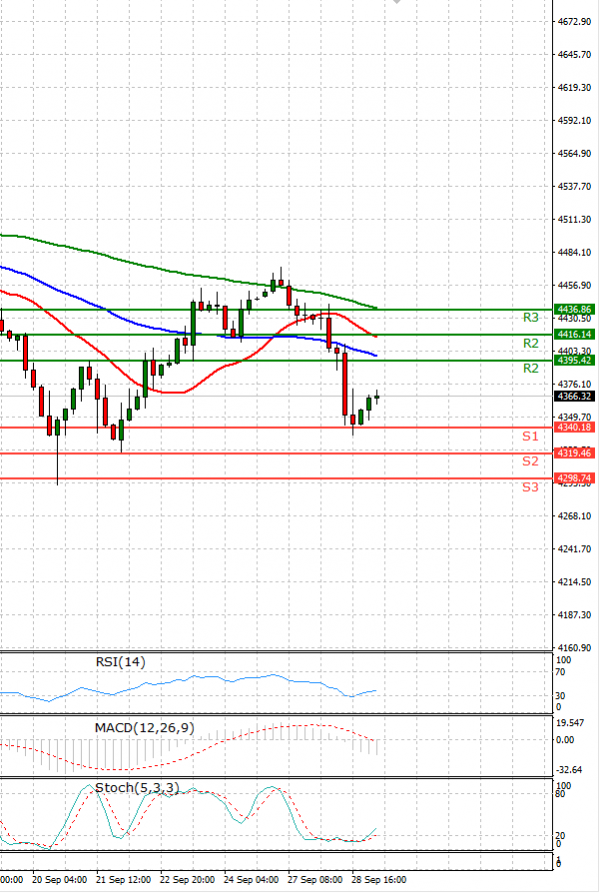
EU Session Analysis for CFD Instruments 29/09/2021
Fundamental analysis
29 September, 2021
Wall Street stocks ended sharply lower on Tuesday in a broad sell-off driven by rising U.S. Treasury yields, deepening concerns over persistent inflation, and contentious debt ceiling negotiations in Washington. U.S. Treasury yields continued rising, to the highest level since June, as inflation expectations heated up and fears grew that the U.S. Federal Reserve could shorten its timeline for tightening its monetary policy. Treasury Secretary Janet Yellen said she expected inflation to end 2021 near 4% and warned lawmakers their failure to avert a government shutdown as the nation moves closer to exhausting its borrowing capabilities could cause “serious harm” to the economy. Senate Republicans appeared set to strike down Democrats’ efforts to extend the government’s borrowing authority and avoid a potential U.S. credit default.