Fortrade Canada Ltd. as an order-execution only dealer is not permitted to provide you with any advice or recommendations. These Market Commentaries should not be construed as a recommendation, advice or any attempt by Fortrade Canada Ltd. to prompt or influence you in making an investment decision to purchase, sell, hold or exchange any security or to influence the timing of such activity. This content is produced by Fortrade Limited which is not registered in any capacity with any securities regulatory authority in Canada.
69% of retail investor accounts lose money when trading CFDs with this provider.
CFDs are complex instruments and come with a high risk of losing money rapidly due to leverage. 69% of retail investor accounts lose money when trading CFDs with this provider. You should consider whether you understand how CFDs work and whether you can afford to take the high risk of losing your money.
67.52% of retail investor accounts lose money when trading CFDs with this provider.
CFDs are complex instruments and come with a high risk of losing money rapidly due to leverage. 67.52% of retail investor accounts lose money when trading CFDs with this provider. You should consider whether you understand how CFDs work and whether you can afford to take the high risk of losing all your money. Read full risk warning.
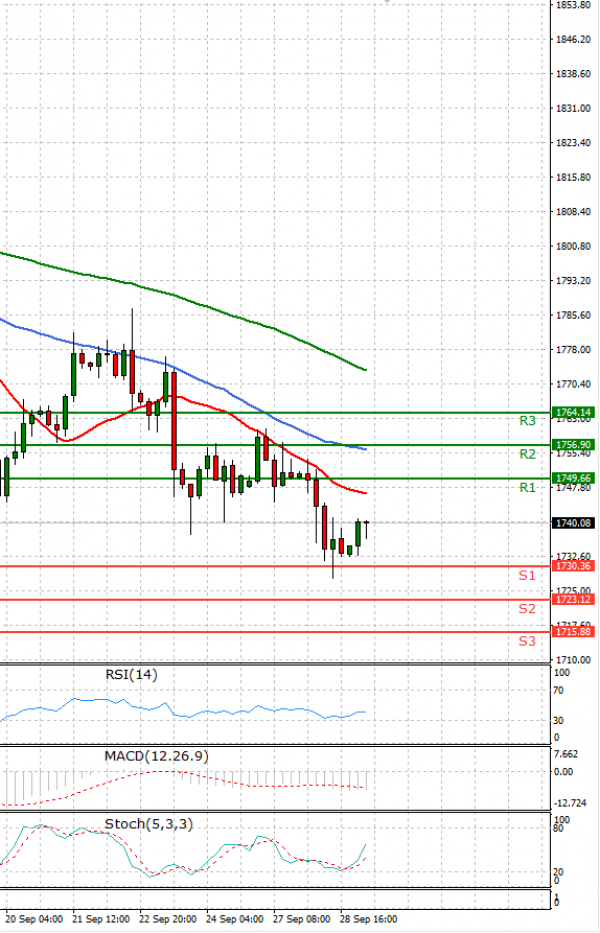
EU Session Analysis for CFD Instruments 29/09/2021
Fundamental analysis
29 September, 2021
Gold prices crawled up on Wednesday as U.S. Treasury yields slightly eased, but held close to a seven-week trough on growing expectations of a quicker-than-expected U.S. rate hike that pushed the dollar to a multi-month high. The dollar index hovered near a more than 10-month high, touched on Tuesday. Though the benchmark U.S. 10-year Treasury yields eased off a bit, it held above 1.5%, a level last seen in June. Higher yields translate into higher opportunity costs for holding non-interest bearing bullion. St. Louis Federal Reserve President James Bullard on Tuesday cautioned high inflation may require more aggressive steps by the central bank, including two interest rate hikes in 2022. In his testimony before the U.S. Senate Banking Committee, Fed Chair Jerome Powell said the U.S. economy is still far from achieving maximum employment, a key component of the central bank’s requirements for raising interest rates.