Fortrade Canada Ltd. as an order-execution only dealer is not permitted to provide you with any advice or recommendations. These Market Commentaries should not be construed as a recommendation, advice or any attempt by Fortrade Canada Ltd. to prompt or influence you in making an investment decision to purchase, sell, hold or exchange any security or to influence the timing of such activity. This content is produced by Fortrade Limited which is not registered in any capacity with any securities regulatory authority in Canada.
71% of retail investor accounts lose money when trading CFDs with this provider.
CFDs are complex instruments and come with a high risk of losing money rapidly due to leverage. 71% of retail investor accounts lose money when trading CFDs with this provider. You should consider whether you understand how CFDs work and whether you can afford to take the high risk of losing your money.
70.91% of retail investor accounts lose money when trading CFDs with this provider.
CFDs are complex instruments and come with a high risk of losing money rapidly due to leverage. 70.91% of retail investor accounts lose money when trading CFDs with this provider. You should consider whether you understand how CFDs work and whether you can afford to take the high risk of losing all your money. Read full risk warning.
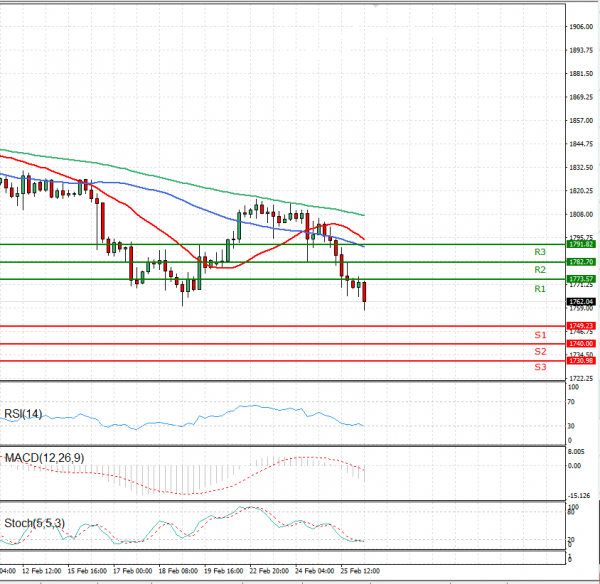
EU Session Analysis for CFD Instruments 26/02/2021
Fundamental analysis
26 February, 2021
Gold inched higher after hitting a one-week low on Friday, but headed for a second straight weekly and monthly decline as brighter economic outlook and inflation fears propped up U.S. Treasury yields. Prices had dropped 1.9% on Thursday as benchmark U.S. Treasury yields hit their highest since the pandemic began, lifting the dollar. Higher inflation boosts gold but also lifts Treasury yields, which in turn increase the opportunity cost of holding non-yielding bullion. Gold prices remained under pressure due to rising treasury bond yields in the United States. The 10-Year yield nearly hit 1.50%.