CFDs are complex instruments and come with a high risk of losing money rapidly due to leverage. 71% of retail investor accounts lose money when trading CFDs with this provider. You should consider whether you understand how CFDs work and whether you can afford to take the high risk of losing your money.
CFDs are complex instruments and come with a high risk of losing money rapidly due to leverage. 70.91% of retail investor accounts lose money when trading CFDs with this provider. You should consider whether you understand how CFDs work and whether you can afford to take the high risk of losing all your money. Read full risk warning.

USA500 Analysis

EU Session Analysis for CFD Instruments 26/02/2021

Fundamental analysis

26 February, 2021

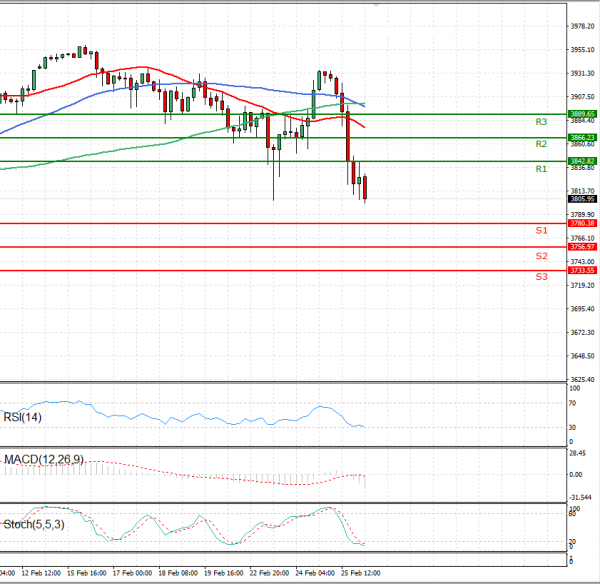
Wall Street’s main indexes tumbled on Thursday, with the Nasdaq index posting its largest daily percentage fall in four months, as technology-related stocks remained under pressure following a rise in U.S. bond yields. The Dow and the S&P 500 notched their biggest daily decline since late January. The USA500 got monkey hammered as treasury yields rose in the United States. Initial Jobless Claims for the past week were 730,000. That was much better than the 838,000 that had been forecast. Core Durable Goods for January printed at 1.4%, Month-over-Month. Analysts had expected only 0.7%. Pending Home Sales for January fell 2.8%, Month-over-Month. The consensus forecast was a drop of only 0.2%. The 4th Quarter GDP revision came in at 4.1%, Quarter-over-Quarter, a tenth of a percentage point less than predicted.

Technical analysis

USA500 Analysis Technical analysis 26/02/2021
Time Frame: 1 hour

USA500 Support & Resistance Table - 26/02/2021

Support & Resistance Level Explanation
Resistance 2 3866.23 Daily R2
Resistance 1 3842.82 Daily R1
Support 1 3780.38 Daily S1
Support 2 3756.97 Daily S2

USA500 Indicator Table - 26/02/2021

Indicator Signal
SMA 20 Sell
SMA 50 Sell
SMA 100 Sell
MACD( 12;26;9) Sell
RSI (14) Sell
Stochastic ( 9;6;3) Sell

USA500 Indicator / Period Table - 26/02/2021

Indicator / Period Day - SellWeek - BuyMonth - Buy
MACD( 12;26;9) Sell BuyBuy
RSI (14) Sell BuyBuy
SMA 20 Sell BuyBuy

USA500 26/02/2021 - Reference Price : 3805.95

Sell
Simple Moving AverageBuy (0)Sell (3)
Technical Indicators - OscillatorsBuy (0)Sell (3)
Share It With Your Network
USA500 Chart
Update Time: -
Highest
Lowest
1M 5M H D W
Prices are loading..
Ready for trading?Start Now