CFDs are complex instruments and come with a high risk of losing money rapidly due to leverage. 71% of retail investor accounts lose money when trading CFDs with this provider. You should consider whether you understand how CFDs work and whether you can afford to take the high risk of losing your money.
CFDs are complex instruments and come with a high risk of losing money rapidly due to leverage. 70.41% of retail investor accounts lose money when trading CFDs with this provider. You should consider whether you understand how CFDs work and whether you can afford to take the high risk of losing all your money. Read full risk warning.

Gold - Usd Dollar Analysis

EU Session Analysis for CFD Instruments 10/05/2021

Fundamental analysis

10 May, 2021

Gold prices inched higher on Monday to trade near a three-month peak hit last week after weaker-than-expected U.S. jobs data supported hopes that interest rates will remain low for some time, bolstering the metal’s appeal. Data released on Friday showed U.S. job growth unexpectedly slowed in April, as businesses scrambled for workers and raw materials amid rapidly improving public health and massive government aid. The 266,000 jobs that U.S. firms added last month were “nowhere near” what was expected, a Federal Reserve official said. The U.S. central bank has pledged to keep interest rates near zero until inflation and employment pick up. Lower interest rates decrease the opportunity cost of holding non-yielding bullion and weigh on the dollar, making gold cheaper for investors holding other currencies. The dollar index languished near a more than two-month low against its rivals. Reflecting increased investor interest in gold, holdings in the world’s largest gold-backed exchange-traded fund, SPDR Gold Trust, rose 0.6% on Friday. Speculators increased their bullish positions in COMEX gold and silver contracts in the week to May 4.
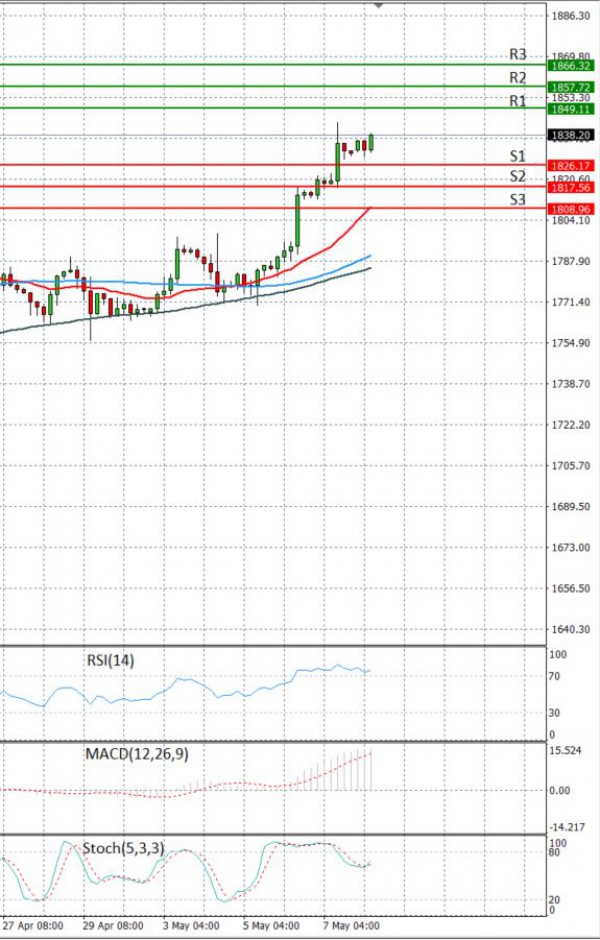
Technical analysis

Gold - Usd Dollar Analysis Technical analysis 10/05/2021
Time Frame: 1 hour

GOLD Support & Resistance Table - 10/05/2021

Support & Resistance Level Explanation
Resistance 2 1857.72 Daily R2
Resistance 1 1849.11 Daily R1
Support 1 1826.17 Daily S1
Support 2 1817.56 Daily S2

GOLD Indicator Table - 10/05/2021

Indicator Signal
SMA 20 Buy
SMA 50 Buy
SMA 100 Buy
MACD( 12;26;9) Buy
RSI (14) Buy
Stochastic ( 9;6;3) Buy

GOLD Indicator / Period Table - 10/05/2021

Indicator / Period Day - BuyWeek - BuyMonth - Buy
MACD( 12;26;9) Buy BuyBuy
RSI (14) Buy BuyBuy
SMA 20 Buy BuyBuy

GOLD 10/05/2021 - Reference Price : 1837.64

Buy
Simple Moving AverageBuy (3)Sell (0)
Technical Indicators - OscillatorsBuy (3)Sell (0)
Share It With Your Network
GOLD Chart
Update Time: -
Highest
Lowest
1M 5M H D W
Prices are loading..
Ready for trading?Start Now