Fortrade Canada Ltd. as an order-execution only dealer is not permitted to provide you with any advice or recommendations. These Market Commentaries should not be construed as a recommendation, advice or any attempt by Fortrade Canada Ltd. to prompt or influence you in making an investment decision to purchase, sell, hold or exchange any security or to influence the timing of such activity. This content is produced by Fortrade Limited which is not registered in any capacity with any securities regulatory authority in Canada.
69% of retail investor accounts lose money when trading CFDs with this provider.
CFDs are complex instruments and come with a high risk of losing money rapidly due to leverage. 69% of retail investor accounts lose money when trading CFDs with this provider. You should consider whether you understand how CFDs work and whether you can afford to take the high risk of losing your money.
70.88% of retail investor accounts lose money when trading CFDs with this provider.
CFDs are complex instruments and come with a high risk of losing money rapidly due to leverage. 70.88% of retail investor accounts lose money when trading CFDs with this provider. You should consider whether you understand how CFDs work and whether you can afford to take the high risk of losing all your money. Read full risk warning.
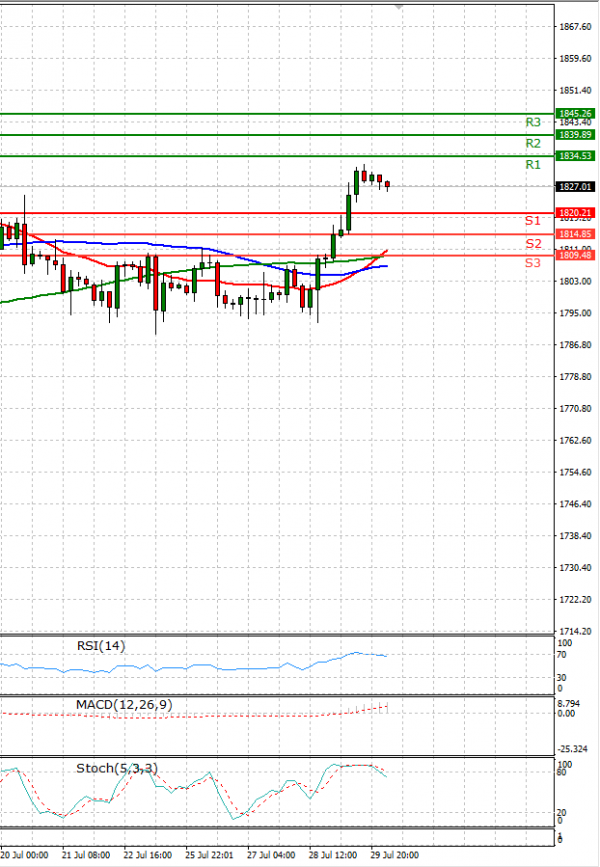
EU Session Analysis for CFD Instruments 30/07/2021
Fundamental analysis
30 July, 2021
Gold prices were on track for their biggest weekly gain in more than two months on renewed signs that the U.S. Federal Reserve may not taper economic support and hike interest rates in the near term. It was on track for its biggest weekly gain since May 21, having risen 1.4% so far. While the dollar index tried clawing up from a one-month low early on Friday, it was headed for its worst weekly performance since May. A weaker dollar boosts the appeal of gold by making it cheaper for holders of other currencies. Gold jumped as much as 1.4% on Thursday following Fed Chief Jerome Powell’s remarks that the U.S. job market still had “some ground to cover” and that it was “ways away” from considering interest rate hikes.