Fortrade Canada Ltd. as an order-execution only dealer is not permitted to provide you with any advice or recommendations. These Market Commentaries should not be construed as a recommendation, advice or any attempt by Fortrade Canada Ltd. to prompt or influence you in making an investment decision to purchase, sell, hold or exchange any security or to influence the timing of such activity. This content is produced by Fortrade Limited which is not registered in any capacity with any securities regulatory authority in Canada.
69% of retail investor accounts lose money when trading CFDs with this provider.
CFDs are complex instruments and come with a high risk of losing money rapidly due to leverage. 69% of retail investor accounts lose money when trading CFDs with this provider. You should consider whether you understand how CFDs work and whether you can afford to take the high risk of losing your money.
70.88% of retail investor accounts lose money when trading CFDs with this provider.
CFDs are complex instruments and come with a high risk of losing money rapidly due to leverage. 70.88% of retail investor accounts lose money when trading CFDs with this provider. You should consider whether you understand how CFDs work and whether you can afford to take the high risk of losing all your money. Read full risk warning.
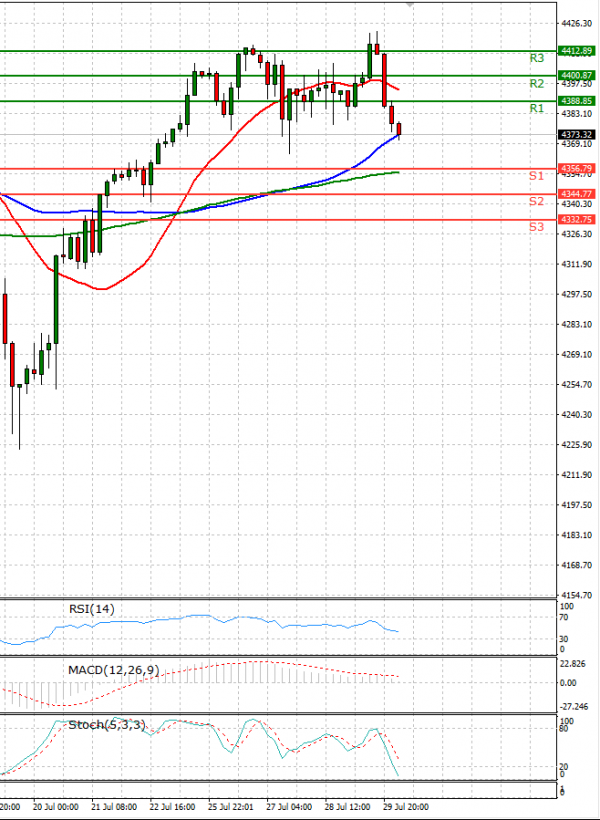
EU Session Analysis for CFD Instruments 30/07/2021
Fundamental analysis
30 July, 2021
U.S. stocks ended higher on Thursday, boosted by robust U.S. earnings and forecasts, while data showed the U.S. economy was above its pre-pandemic level. The U.S. economy grew solidly in the second quarter, putting the level of gross domestic product above its pre-pandemic peak, but the pace of GDP growth was slower than economists had expected. Stocks were boosted on Wednesday after the Fed said it was not yet time to start withdrawing its massive monetary stimulus. About half of the S&P 500 companies had reported second-quarter earnings as of Thursday morning. Nearly 91% of those companies beat profit estimates, and second-quarter earnings now are expected to have jumped 87.2% from a year ago, according to Refinitiv data.