CFDs are complex instruments and come with a high risk of losing money rapidly due to leverage. 71% of retail investor accounts lose money when trading CFDs with this provider. You should consider whether you understand how CFDs work and whether you can afford to take the high risk of losing your money.
CFDs are complex instruments and come with a high risk of losing money rapidly due to leverage. 70.91% of retail investor accounts lose money when trading CFDs with this provider. You should consider whether you understand how CFDs work and whether you can afford to take the high risk of losing all your money. Read full risk warning.

Gold - Usd Dollar Analysis

EU Session Analysis for CFD Instruments 03/09/2021

Fundamental analysis

03 September, 2021

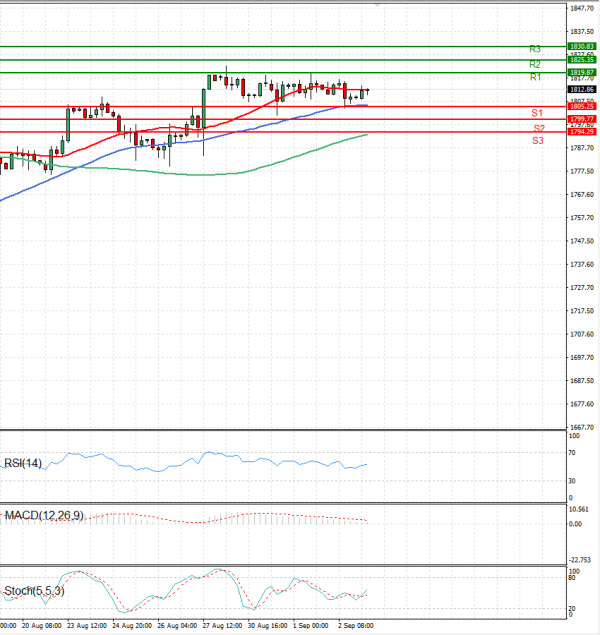
During Asian trade, the price of gold rose slightly. Caution is still present ahead the publication of the NFP report from the American labor market this afternoon. The day before yesterday, ADP hinted that it could fail considerably compared to the previous month, which should support the price of the precious metal. ADP showed that the number of newly created jobs in the private sector in the US is only 374,000, which is much lower than expected. If this trend is confirmed today, investors expect that the FED could refrain from gradual tapering worth 120 billion dollars a month, which would be an incentive for the price of gold. At around 08:15, the price of gold is trading at 1814 dollars per fine ounce, which represents a price increase of 0.11%. At 2:30 p.m. a regular NFP report from the U.S. labor market for August will be released.

Technical analysis

Gold - Usd Dollar Analysis Technical analysis 03/09/2021
Time Frame: 1 hour

GOLD Support & Resistance Table - 03/09/2021

Support & Resistance Level Explanation
Resistance 2 1825.35 Daily R2
Resistance 1 1819.87 Daily R1
Support 1 1805.25 Daily S1
Support 2 1799.77 Daily S2

GOLD Indicator Table - 03/09/2021

Indicator Signal
SMA 20 Buy
SMA 50 Buy
SMA 100 Buy
MACD( 12;26;9) Buy
RSI (14) Buy
Stochastic ( 9;6;3) Buy

GOLD Indicator / Period Table - 03/09/2021

Indicator / Period Day - BuyWeek - SellMonth - Buy
MACD( 12;26;9) Buy SellBuy
RSI (14) Buy NeutralBuy
SMA 20 Buy SellBuy

GOLD 03/09/2021 - Reference Price : 1812.86

Buy
Simple Moving AverageBuy (3)Sell (0)
Technical Indicators - OscillatorsBuy (3)Sell (0)
Share It With Your Network
GOLD Chart
Update Time: -
Highest
Lowest
1M 5M H D W
Prices are loading..
Ready for trading?Start Now