At the end of the Asian session, futures tied to this index (subject to trading on the MT4 platform) recorded an increase of 0,19%. A growth of American stock indexes was recorded on Thursday. The Dow Jones dropped 131 points, while the S&P500 closed at 4,536.95 points, which is an increase of 0.28%. Technology-based Nasdaq rose 0.14%. Exxon Mobil (+ 2.44%) and Apple (+ 0.75%) stood out among the winners, and Vis (-2.58%) and Microsoft (-0.23%) were the biggest losers. Since the turn of the year, the index has risen 20.79%. There is still fresh money in abundance, so for now it seems that the upward trend of the index is not in danger.
USA500 Analysis
EU Session Analysis for CFD Instruments 03/09/2021
Technical analysis
Time Frame: 1 hour
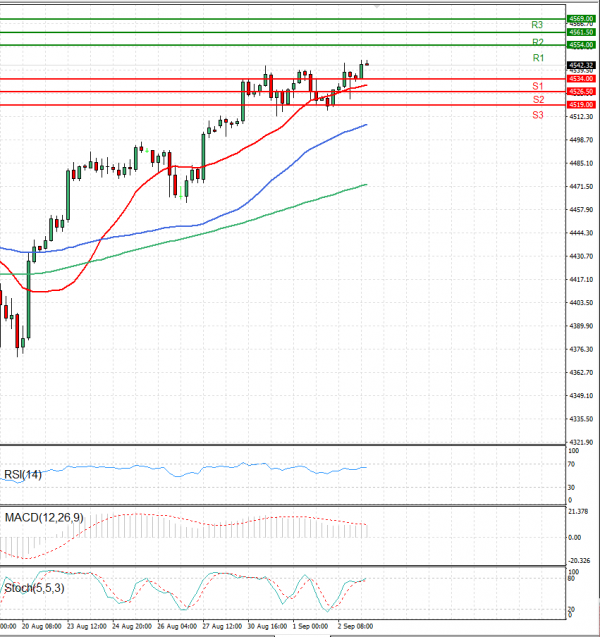
USA500 Support & Resistance Table - 03/09/2021
| Support & Resistance | Level | Explanation |
| Resistance 2 | 4561.50 | Daily R2 |
| Resistance 1 | 4554.00 | Daily R1 |
| Support 1 | 4534.00 | Daily S1 |
| Support 2 | 4526.50 | Daily S2 |
USA500 Indicator Table - 03/09/2021
| Indicator | Signal |
| SMA 20 | Buy |
| SMA 50 | Buy |
| SMA 100 | Buy |
| MACD( 12;26;9) | Buy |
| RSI (14) | Neutral |
| Stochastic ( 9;6;3) | Buy |
USA500 Indicator / Period Table - 03/09/2021
| Indicator / Period | Day - Buy | Week - Buy | Month - Buy |
| MACD( 12;26;9) | Buy | Buy | Buy |
| RSI (14) | Neutral | Buy | Buy |
| SMA 20 | Buy | Buy | Buy |
USA500 03/09/2021 - Reference Price : 4542.32
| Buy |
|
Ready for trading?Start Now