CFDs are complex instruments and come with a high risk of losing money rapidly due to leverage. 66% of retail investor accounts lose money when trading CFDs with this provider. You should consider whether you understand how CFDs work and whether you can afford to take the high risk of losing your money.
CFDs are complex instruments and come with a high risk of losing money rapidly due to leverage. 70.91% of retail investor accounts lose money when trading CFDs with this provider. You should consider whether you understand how CFDs work and whether you can afford to take the high risk of losing all your money. Read full risk warning.

USA500 Analysis

EU Session Analysis for CFD Instruments 19/07/2021

Fundamental analysis

19 July, 2021

Wall Street ended lower on Friday, weighed down by declines in Amazon, Apple and other heavyweight technology stocks, while investors worried about a rise in coronavirus cases tied to the highly contagious Delta variant. On Thursday, Los Angeles County said it would reimpose its mask mandate this weekend. On Friday, public health officials said U.S. coronavirus cases were up 70% over the previous week, with deaths up 26%. Amazon, Apple and Nvidia all fell and were among the stocks that contributed most to the S&P 500 and Nasdaq’s declines. The S&P 500 technology sector index dipped for a second session after hitting a record on Wednesday. This week, investors have balanced worries about a recent inflation spike with reassurances from Fed Chair Jerome Powell that the surge in prices is temporary. Second-quarter earnings season picks up next week, with reports from companies including Netflix, Johnson & Johnson, Verizon Communications, AT&T and Intel. Analysts on average expect 72% growth in earnings per share for S&P 500 companies, according to IBES estimate data from Refinitiv.
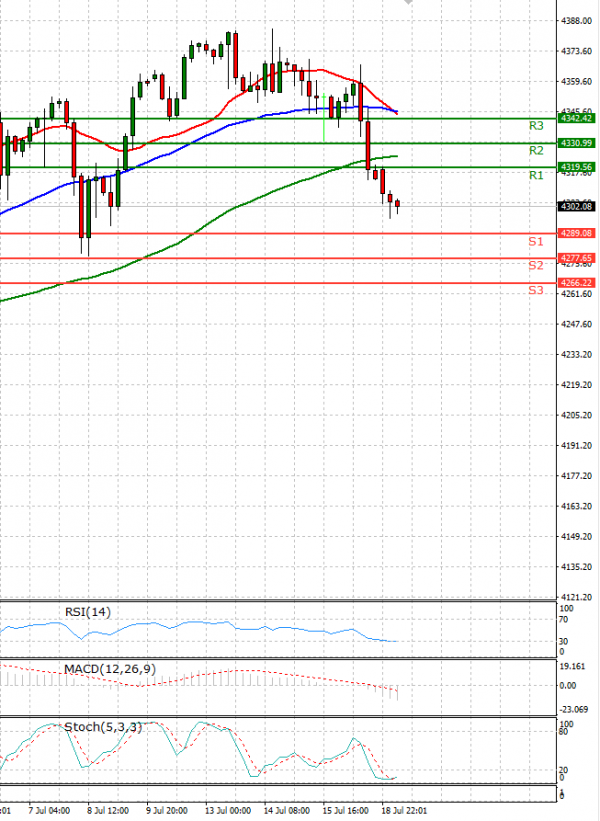
Technical analysis

USA500 Analysis Technical analysis 19/07/2021
Time Frame: 1 hour

USA500 Support & Resistance Table - 19/07/2021

Support & Resistance Level Explanation
Resistance 2 4330.99 Daily R2
Resistance 1 4319.56 Daily R1
Support 1 4289.08 Daily S1
Support 2 4277.65 Daily S2

USA500 Indicator Table - 19/07/2021

Indicator Signal
SMA 20 Sell
SMA 50 Sell
SMA 100 Sell
MACD( 12;26;9) Sell
RSI (14) Sell
Stochastic ( 9;6;3) Sell

USA500 Indicator / Period Table - 19/07/2021

Indicator / Period Day - SellWeek - BuyMonth - Buy
MACD( 12;26;9) Sell BuyBuy
RSI (14) Sell BuyBuy
SMA 20 Sell SellBuy

USA500 19/07/2021 - Reference Price : 4304.32

Sell
Simple Moving AverageBuy (0)Sell (3)
Technical Indicators - OscillatorsBuy (0)Sell (3)
Share It With Your Network
USA500 Chart
Update Time: -
Highest
Lowest
1M 5M H D W
Prices are loading..
Ready for trading?Start Now