Fortrade Canada Ltd. as an order-execution only dealer is not permitted to provide you with any advice or recommendations. These Market Commentaries should not be construed as a recommendation, advice or any attempt by Fortrade Canada Ltd. to prompt or influence you in making an investment decision to purchase, sell, hold or exchange any security or to influence the timing of such activity. This content is produced by Fortrade Limited which is not registered in any capacity with any securities regulatory authority in Canada.
69% of retail investor accounts lose money when trading CFDs with this provider.
CFDs are complex instruments and come with a high risk of losing money rapidly due to leverage. 69% of retail investor accounts lose money when trading CFDs with this provider. You should consider whether you understand how CFDs work and whether you can afford to take the high risk of losing your money.
67.52% of retail investor accounts lose money when trading CFDs with this provider.
CFDs are complex instruments and come with a high risk of losing money rapidly due to leverage. 67.52% of retail investor accounts lose money when trading CFDs with this provider. You should consider whether you understand how CFDs work and whether you can afford to take the high risk of losing all your money. Read full risk warning.
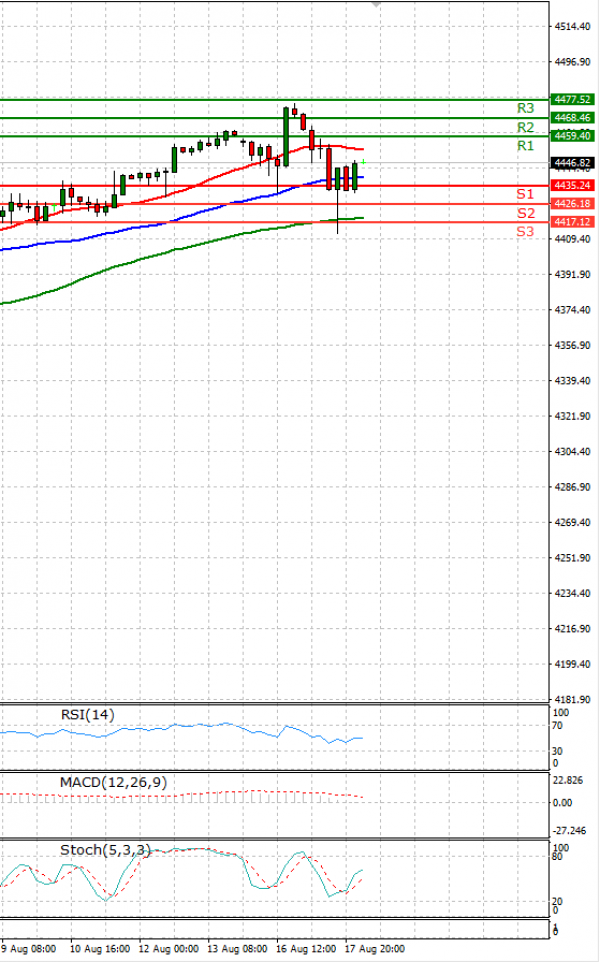
EU Session Analysis for CFD Instruments 18/08/2021
Fundamental analysis
18 August, 2021
All Street’s main indexes slid on Tuesday, weighed down by a drop in U.S. retail sales that raised concerns about the economic recovery, as well as by disappointing results from Home Depot. Almost all of the S&P 500’s sectors were lower, with consumer discretionary the weakest performer. A report showed that U.S. retail sales fell more than expected in July, as supply shortages depressed motor vehicle purchases and the boost to spending from the economy’s reopening and stimulus checks faded, suggesting a slowdown in growth early in the third quarter.