Fortrade Canada Ltd. as an order-execution only dealer is not permitted to provide you with any advice or recommendations. These Market Commentaries should not be construed as a recommendation, advice or any attempt by Fortrade Canada Ltd. to prompt or influence you in making an investment decision to purchase, sell, hold or exchange any security or to influence the timing of such activity. This content is produced by Fortrade Limited which is not registered in any capacity with any securities regulatory authority in Canada.
70% of retail investor accounts lose money when trading CFDs with this provider.
CFDs are complex instruments and come with a high risk of losing money rapidly due to leverage. 70% of retail investor accounts lose money when trading CFDs with this provider. You should consider whether you understand how CFDs work and whether you can afford to take the high risk of losing your money.
70.41% of retail investor accounts lose money when trading CFDs with this provider.
CFDs are complex instruments and come with a high risk of losing money rapidly due to leverage. 70.41% of retail investor accounts lose money when trading CFDs with this provider. You should consider whether you understand how CFDs work and whether you can afford to take the high risk of losing all your money. Read full risk warning.
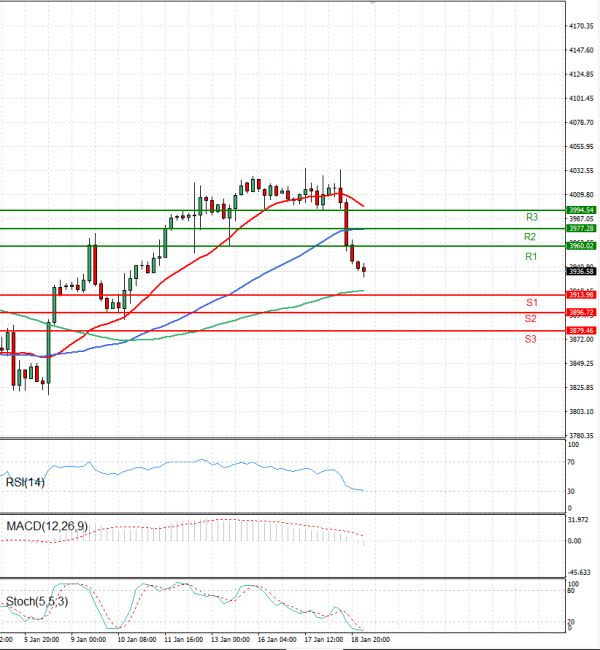
EU Session Analysis for CFD Instruments 19/01/2023
Fundamental analysis
19 January, 2023
Wall Street's main indexes closed lower on Wednesday after weak economic data and hawkish comments from Federal Reserve officials sparked worries that the central bank will keep tightening policy, perhaps enough to cause a recession. Before the market opened, U.S. economic data showed retail sales and producer prices declined more than expected in December. Also production at U.S. factories fell more than expected in December and output in the prior month was weaker than previously thought. Moderna shares rose after reporting data which demonstrated the effectiveness of its respiratory syncytial virus (RSV) vaccine.