CFDs are complex instruments and come with a high risk of losing money rapidly due to leverage. 71% of retail investor accounts lose money when trading CFDs with this provider. You should consider whether you understand how CFDs work and whether you can afford to take the high risk of losing your money.
CFDs are complex instruments and come with a high risk of losing money rapidly due to leverage. 70.91% of retail investor accounts lose money when trading CFDs with this provider. You should consider whether you understand how CFDs work and whether you can afford to take the high risk of losing all your money. Read full risk warning.

USA500 Analysis

EU Session Analysis for CFD Instruments 17/12/2024

Fundamental analysis

17 December, 2024

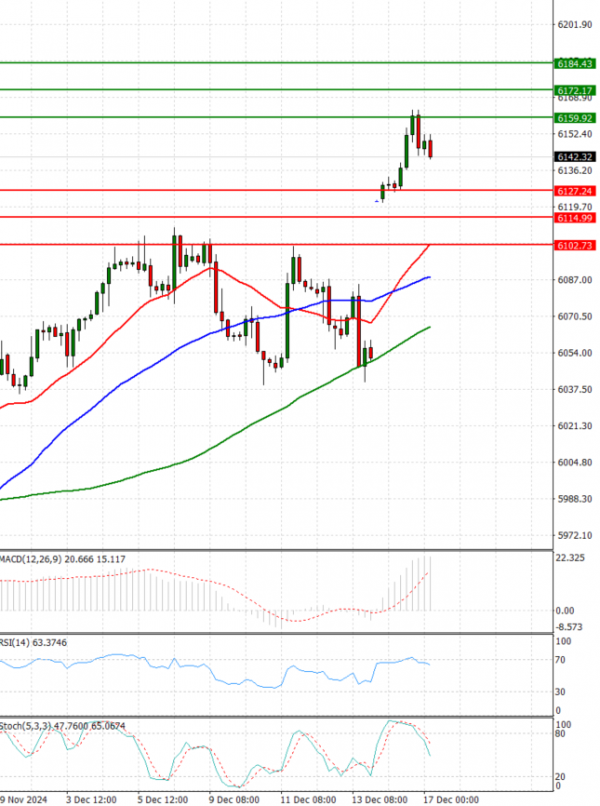
The USA500 is currently trading above 6,100 levels.

The Nasdaq closed at a record high on Monday and the S&P 500 also rose as investors considered the latest economic data while looking toward the Federal Reserve's final policy announcement of the year on Wednesday to gauge the path of interest rates.

On Monday the S&P 500 was up 0.38%, the Nasdaq 100 climbed 1.24%, while the Dow Jones declined -0.25%.

Technical analysis

USA500 Analysis Technical analysis 17/12/2024
Time Frame: 1 hour

USA500 Support & Resistance Table - 17/12/2024

Support & Resistance Level Explanation
Resistance 2 6172.17 Daily R2
Resistance 1 6159.92 Daily R1
Support 1 6127.24 Daily S1
Support 2 6114.99 Daily S2

USA500 Indicator Table - 17/12/2024

Indicator Signal
SMA 20 Buy
SMA 50 Buy
SMA 100 Buy
MACD( 12;26;9) Buy
RSI (14) Buy
Stochastic ( 9;6;3) Buy

USA500 Indicator / Period Table - 17/12/2024

Indicator / Period Day - BuyWeek - BuyMonth - Buy
MACD( 12;26;9) Buy BuyBuy
RSI (14) Buy BuyBuy
SMA 20 Buy BuyBuy

USA500 17/12/2024 - Reference Price : 6143.58

Buy
Simple Moving AverageBuy (3)Sell (0)
Technical Indicators - OscillatorsBuy (3)Sell (0)
Share It With Your Network
USA500 Chart
Update Time: -
Highest
Lowest
1M 5M H D W
Prices are loading..
Ready for trading?Start Now