Fortrade Canada Ltd. as an order-execution only dealer is not permitted to provide you with any advice or recommendations. These Market Commentaries should not be construed as a recommendation, advice or any attempt by Fortrade Canada Ltd. to prompt or influence you in making an investment decision to purchase, sell, hold or exchange any security or to influence the timing of such activity. This content is produced by Fortrade Limited which is not registered in any capacity with any securities regulatory authority in Canada.
69% of retail investor accounts lose money when trading CFDs with this provider.
CFDs are complex instruments and come with a high risk of losing money rapidly due to leverage. 69% of retail investor accounts lose money when trading CFDs with this provider. You should consider whether you understand how CFDs work and whether you can afford to take the high risk of losing your money.
67.52% of retail investor accounts lose money when trading CFDs with this provider.
CFDs are complex instruments and come with a high risk of losing money rapidly due to leverage. 67.52% of retail investor accounts lose money when trading CFDs with this provider. You should consider whether you understand how CFDs work and whether you can afford to take the high risk of losing all your money. Read full risk warning.
EU Session Analysis for CFD Instruments 22/05/2025
Fundamental analysis
22 May, 2025
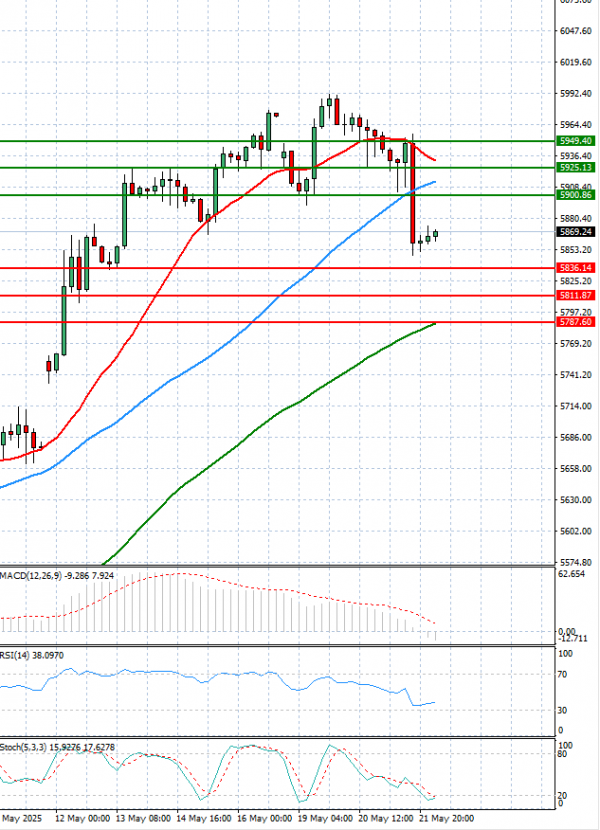
The USA500 is currently trading below 5,900 levels.
U.S. stocks closed sharply lower on Wednesday as Treasury yields spiked on worries that U.S. government debt would swell by trillions of dollars if Congress passes President Donald Trump's proposed tax-cut bill.
On Wednesday the S&P 500 declined 1.61%, the Dow Jones dropped 1.81% and the Nasdaq fell 1.41%.