Gold weekly uptrend opportunity based On 1.00 Lot Calculation:
- EVENT: (Wednesday, August 10th, 13:30 GMT+1): U.S. INFLATION FOR JULY is forecast to fall 8.7% from June’s 9.1%. However Core Inflation is expected to increase to 6.1% in July from 5.9% in June. Inflation remains strong despite the U.S. Federal Reserve’s latest attempts to reign it in with higher rates. Higher inflation usually increases demand for Gold as the asset is traditionally considered a store of value.
- THE US ECONOMY HAS OFFICIALLY ENTERED A RECESSION. The United States GDP printed at -0.9% for its 2nd Quarter. This was the second consecutive negative GDP report, after Q1’s -1.6%, indicating the United States is in a recession.
- STATISTICS ON GOLD PERFORMANCE DURING AN ECONOMIC RECESSION: According to SuisseGold, there have been 8 recessions since 1976 (since the US dropped the gold standard). Historically, Gold tends to rise on average by 7.89% during an economic recession.
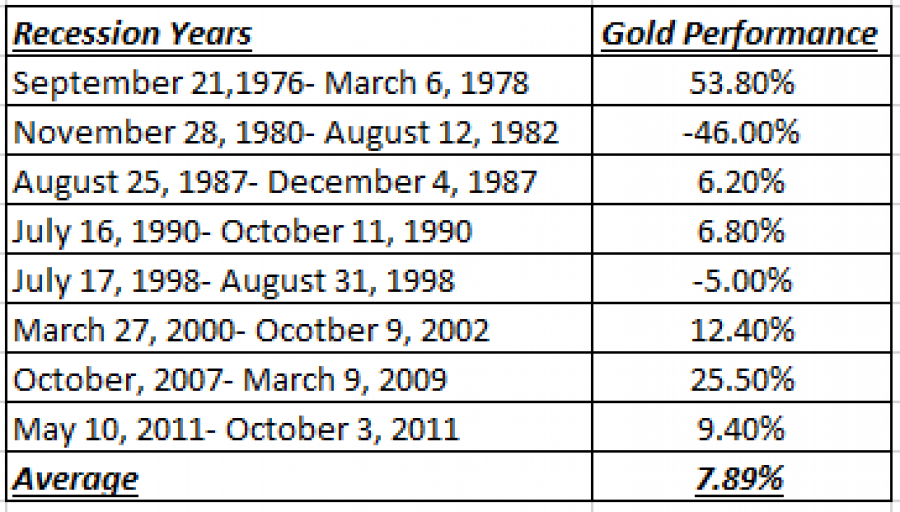
SOURCE: SuisseGold
Please note that past performance does not guarantee future results.
- GOLD PRICE ACTION: Gold reached $2070.06 in 2022. Gold has fallen ever since by around 19%, to test its lowest rate since August 2021 ($1680.57).
- TECHNICAL ANALYSIS: STRONG SUPPORT AT $1700. Since May 2020, Gold has held above $1700, trying to breach below that level only four times. Every time it tests levels below $1700, it would immediately return above that level, confirming a strong support area below $1700.
- ANALYSTS OPINION: Goldman Sachs raised its price target to $2500 by the end of 2022. Citigroup forecasts $1900. Commerzbank expects $1900 by the end of 2022.
GOLD, August 9, 2022
Current Price: 1,780.00
|
Gold |
Weekly |
|
Trend direction |
|
|
2,030.00 |
|
|
1,930.00 |
|
|
1,850.00 |
|
|
1,720.00 |
|
|
1,660.00 |
|
|
1,600.00 |
Example of calculation base on weekly trend direction for 1.00 Lot1
|
Pivot Points |
||||||
|
Profit or loss in $ |
25,000.00 |
15,000.00 |
7,000.00 |
-6,000.00 |
-12,000.00 |
-18,000.00 |
|
Profit or loss in €2 |
24,505.96 |
14,703.58 |
6,861.67 |
-5,881.43 |
-11,762.86 |
-17,644.29 |
|
Profit or loss in £2 |
20,699.48 |
12,419.69 |
5,795.85 |
-4,967.87 |
-9,935.75 |
-14,903.62 |
|
Profit or loss in C$2 |
32,145.50 |
19,287.30 |
9,000.74 |
-7,714.92 |
-15,429.84 |
-23,144.76 |
1. 1.00 lot is equivalent of 100 units
2. Calculations for exchange rate used as of 08:09 (GMT) 09/08/2022
Fortrade recommends the use of Stop-Loss and Take-Profit, please speak to your Client Manager regarding their use.
- You may wish to consider closing your position in profit, even if it is lower than suggested one.
- Trailing stop technique can protect the profit – Ask your Client Manager for more details.