ALPHABET(#GOOGLE) weekly special report based On 1 Lot Calculation:
WEB SEARCH INDUSTRY:
- ALMOST 90% OF ALL INTERNET SEARCHES ARE PERFORMED ON GOOGLE. Other companies that can compete with Google are BING, DuckDuckGo and etc.
ONLINE ADVERTISING:
- MARKET SIZE: $232.7 BILLION IN 2023 AND EXPECTED TO GROW TO $538.2 BILLION IN 2032. The global internet advertising market size was valued at more than $232.7 billion in 2023, and it could reach $538.2 billion by 2032, registering an average growth of 15.7% from 2023 to 2030.
- MARKET SHARE IN THE U.S.: Alphabet (Google) at 26.8%, META (Facebook) at 21.1%, Amazon at 12.5%, Rest at 39.6%.
GOOGLE:
- THE COMPANY: Alphabet (Google) is the fifth-largest company by market capitalization in the world, worth around 2.21 trillion dollars.
- GOOGLE stock belongs to the two most important US stock indices, including the NASDAQ 100 (USA100) index and the S&P 500 (USA500) index.
- STRONG POSITIVE REVENUE TREND (22% AVERAGE GROWTH RATE PER ANNUM FOR THE PAST FIVE YEARS): The company’s revenue grew by around 22% on average per year over the past five years.
GOOGLE: EVENTS
- EVENT (WEDNESDAY, JULY 23, AFTERMARKET): Q2 EARNINGS REPORT. Google is expected to print $93.83 billion in revenue, up around 10.73% from the same period last year ($84.742.18 billion). The company is expected to print earnings per share (EPS) of $2.18, up 15.35% from the same period last year ($1.89) (Source: Yahoo Finance).
- REVENUE AND EARNINGS PERFORMANCE (LAST 8 QUARTERS): GOOGLE TENDS TO BEAT ESTIMATES. The company has beaten Earnings Per Share (EPS) estimates 8 times over the past 8 quarters, while its revenue has managed to beat estimates 6 times over the past 8 quarters.
Please note that past performance does not guarantee future results
GOOGLE: PRICE ACTIONS
- GOOGLE HIT AN ALL-TIME HIGH OF $208.43 ON FEBRUARY 4, 2025. The Google stock price was last trading around $183, and a full recovery to the most recent all-time highs ($208.43) would take place, which could provide an upside of around 14%. Although the stock price could decline as well.
- ANALYST OPINION: Barclays forecasts $220, JPMorgan forecasts $200, Citigroup $216, Jefferies $235.
TECHNICAL ANALYSIS:
- DAILY MOVING AVERAGES POINT: Google prices have remained above the 50 - and 100-day moving averages, pointing to an ongoing uptrend. However, Google prices can also change their trend if prices fall below the 50 - and 100 - day moving averages.
- MID–TERM: As depicted by the daily chart below, the Google price has kept trading above the mid-term red-lined uptrend line, confirming its mid-term trend is up. However, there is a risk of a potential breakout below this level if market conditions change.
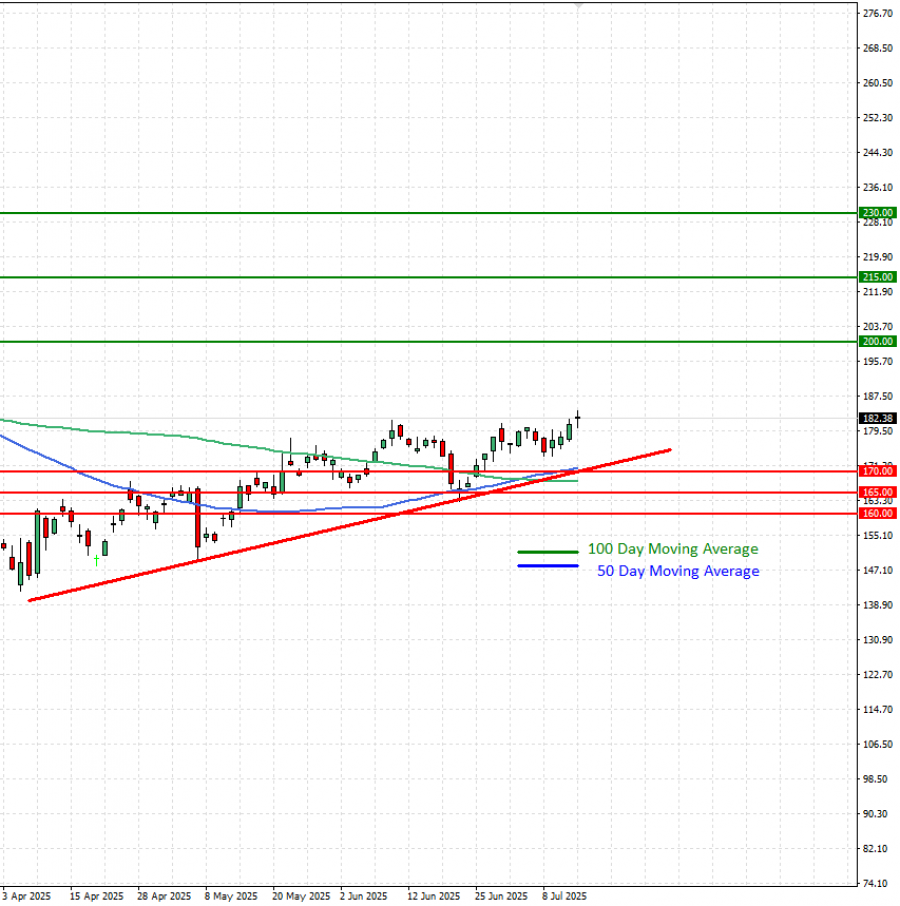 GRAPH (Daily): April 2025 – July 2025
Please note that past performance does not guarantee future results
#GOOGLE, JULY 16, 2025
Current Price: 183
|
|
Weekly |
|
Trend direction |
|
|
230 |
|
|
215 |
|
|
200 |
|
|
170 |
|
|
165 |
|
|
160 |
Example of calculation based on weekly trend direction for 1 Lot1
|
|
||||||
|
Pivot Points |
||||||
|
Profit or loss in $ |
4,700 |
3,200 |
1,700 |
-1,300 |
-1,800 |
-2,300 |
|
Profit or loss in €2 |
4,043 |
2,753 |
1,462 |
-1,118 |
-1,549 |
-1,979 |
|
Profit or loss in £2 |
3,509 |
2,389 |
1,269 |
-971 |
-1,344 |
-1,717 |
|
Profit or loss in C$2 |
6,448 |
4,390 |
2,332 |
-1,784 |
-2,470 |
-3,156 |
- 1.00 lot is equivalent of 100 units
- Calculations for exchange rate used as of 11:00 (GMT+1) 16/07/2025
There is a possibility to use Stop-Loss and Take-Profit.
- You may wish to consider closing your position in profit, even if it is lower than suggested one.
- Trailing stop technique could protect the profit.