Tesla (#TSLA) weekly special report based on 1 Lot Calculation:
TESLA: THE COMPANY
- Tesla produces several Electric Vehicles (EVs), including the Model 3, Model X, Model Y, Model S, and, since recently, the Cybertruck. Tesla also delivers the Semi-Truck.
- STOCK INDEX PARTICIPATION: Tesla stock is part of both the NASDAQ 100 (USA100) index and the S&P 500 (USA500) index.
- MARKET SHARE: Tesla is still the largest seller of pure battery-powered Electric Vehicles (EVs) in the world and an absolute leader in the US (taking up around 50% market share).
TESLA: FINANCIALS AND EVENTS
- EVENT (CONFIRMED: WEDNESDAY, JULY 23, AFTERMARKET): Q2 EARNINGS REPORT. Tesla is expected to print $22.862 billion in revenue, a growth of 12% from the previous quarter, and $1.535 billion in net income, a growth of 164% from the previous quarter. If Tesla manages to beat expectations, it could create positive pressure for its stock price.
- EVENT (THURSDAY, JULY 15): TESLA OPENED ITS FIRST STORE IN INDIA ON JULY 15 IN MUMBAI, INDIA. Tesla has opened its first showroom in the financial hub of Mumbai. The showroom is located in the expensive center part of town. The Model Y being sold there is priced at $69,700 before taxes.
TESLA: PRICE ACTION AND ANALYSTS’ OPINION
- WEDBUSH DAN IVES forecasts $500, FUBON SECURITIES forecasts $470, MORGAN STANELY forecasts $410, PIPER SANDLER forecasts $410, CANTOR FITZGERALD forecasts $355, and DEUTSCHE BANK forecasts $345.
- TESLA’S STOCK PRICE HIT A NEW ALL-TIME HIGH IN LATE 2024: $487.99. The current stock price is around $310, and if the price moves to its recent all-time high levels, this would be a price change of around 57%. However, the price could decline as well.
TECHNICAL ANALYSIS:
- UPTREND CHANNEL SINCE EARLY MARCH 2025: As depicted by the daily chart below, the Tesla stock price has kept trading within the mid-term light blue-lined uptrend channel, confirming its mid-term trend is up. The channel has been in place since early March 2025.
- 100-DAY MOVING AVERAGE POINTS TO AN UPTREND: The 100-Day Moving Average points to an uptrend as the Tesla stock price is currently above it. If the price of Tesla drops below this average, then its trend could change to negative.
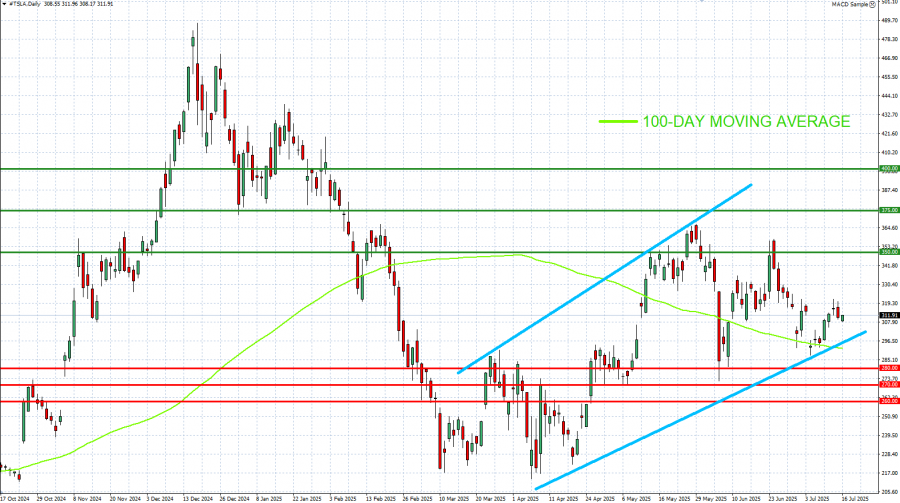
GRAPH (Daily): October 2024 – July 2025
Please note that past performance does not guarantee future results
#TSLA, July 16, 2025
Current Price: 310
|
Tesla |
Weekly |
|
Trend direction |
|
|
400 |
|
|
375 |
|
|
350 |
|
|
280 |
|
|
270 |
|
|
260 |
Example of calculation based on weekly trend direction for 1 Lot1
|
Tesla |
||||||
|
Pivot Points |
||||||
|
Profit or loss in $ |
90,000 |
65,000 |
40,000 |
-30,000 |
-40,000 |
-50,000 |
|
Profit or loss in €2 |
77,438 |
55,928 |
34,417 |
-25,813 |
-34,417 |
-43,021 |
|
Profit or loss in £2 |
67,184 |
48,522 |
29,860 |
-22,395 |
-29,860 |
-37,325 |
|
Profit or loss in C$2 |
123,454 |
89,161 |
54,868 |
-41,151 |
-54,868 |
-68,586 |
- 1.00 lot is equivalent of 1000 units
- Calculations for exchange rate used as of 13:15 (GMT+1) 16/07/2025
There is a possibility to use Stop-Loss and Take-Profit.
- You may wish to consider closing your position in profit, even if it is lower than suggested one.
- Trailing stop technique could protect the profit.