Copper Weekly Special Report based on 1 Lot Calculation:
GLOBAL MINES UNDER SUPPLY RISKS
- WORLD’S TOP COPPER PRODUCERS:
- Chile – about 23% of global output.
- Democratic Republic of Congo - 12% to 14% of global output.
- Peru – 11% to 12% of global output.
- China – around 7.5%.
- United States- around 4.6%.
- WORLD’S LARGEST MINES:
- Escondida (Chile): 8% of global supply.
- Grasberg (Indonesia): 6-7% of global supply.
- Collahuasi (Chile): 2-3% of global supply.
- Kamoa-Kakula (Democratic Republic of Congo): 2-3% of global supply.
- BREAKING (SEPTEMBER 24): SECOND LARGEST COPPER MINE IN THE WORLD IS STILL SHUT DOWN. Located in Indonesia and operated by the US company Freeport, Grasberg is the second-largest copper mine in the world. The mine is responsible for 6% to 7% of the total global supply.
SUPPLY SIDE:
- BREAKING NEWS (OCTOBER 29): GLENCORE REPORTS LOWER COPPER PRODUCTION IN FIRST NINE MONTHS. Glencore reported a 17% decline in copper production for the first nine months of the year, tightening its 2025 guidance due to lower ore grades. Output fell to 583,500 metric tons, with full-year guidance now at 850,000–875,000 tons. (Reuters.com)
- BREAKING NEWS (OCTOBER 28): ANGLO AMERICAN POSTS 9% DROP IN COPPER OUTPUT IN FIRST NINE MONTHS. Anglo American posted a 9% drop in copper output to 526,000 tons for the same period, citing operational challenges in South America. (Reuters.com)
- Glencore (Switzerland) and Anglo American (UK) together produce about 6–7% of global mined copper, with key operations across Chile, Peru, the DR Congo and Australia. Their lower output adds to tightening global supply and supports the bullish outlook for copper prices.
EVENTS:
- TUESDAY, NOVEMBER 25 AT 13:15 GMT: U.S. ADP EMPLOYMENT CHANGE (WEEKLY). A weaker-than-expected employment reading could raise expectations for additional Federal Reserve rate cuts, putting downward pressure on the U.S. dollar and supporting higher copper prices. (PREVIOUS: -2.50K)
- WEDNESDAY, NOVEMBER 26 AT 13:30 GMT: U.S. GROSS DOMESTIC PRODUCT (Q3). A stronger Q3 GDP reading could signal healthier U.S. economic momentum, supporting demand expectations for copper and boosting confidence in key sectors like manufacturing and construction. (PREVIOUS: 3.8%)
- SUNDAY, NOVEMBER 30 AT 1:30 GMT: CHINESE MANUFACTURING PURCHASING MANAGERS INDEX (NOVEMBER). China’s Manufacturing PMI will be closely watched as investors gauge the strength of factory activity. A stronger reading could imply improving industrial demand, supporting a positive outlook for copper consumption. (PREVIOUS: 49.0)
TECHNICAL ANALYSIS:
- UPTREND AND RECOVERY SINCE EARLY AUGUST 2025: Copper prices have traded within an uptrend channel since early August, as depicted by the daily chart below. However, there remains a risk of a potential breakout below this level if market conditions change.
- DAILY MOVING AVERAGES: Copper prices have recently traded above the 20-, 50- and 100-Daily Moving Averages, pointing to an ongoing uptrend. However, Copper prices can also change their trend if prices fall below the 20, - 50, and 100-Daily Moving Averages.
- COPPER PRICE HIT AN ALL-TIME HIGH OF $5.9552 (July 24, 2025): The copper price currently trades around $4.9200, and if a full recovery occurs, then copper prices could see an upside of around 21%. Although the price could decline, too.
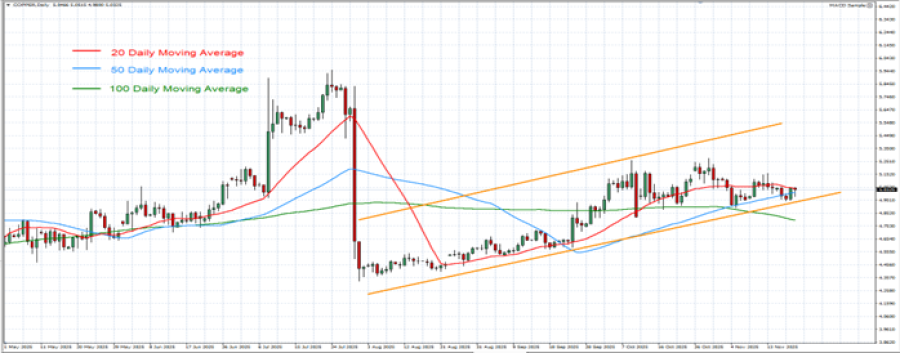
GRAPH (Daily): May 2025 - November 2025
Please note that past performance does not guarantee future results
COPPER, November 20, 2025.
Current Price: 5.0300
|
COPPER |
Weekly |
|
Trend direction |
|
|
6.0000 |
|
|
5.7500 |
|
|
5.3500 |
|
|
4.7500 |
|
|
4.7000 |
|
|
4.6500 |
Example of calculation based on weekly trend direction for 1.00 Lot1
|
COPPER |
||||||
|
Pivot Points |
||||||
|
Profit or loss in $ |
9,700 |
7,200 |
3,200 |
-2,800 |
-3,300 |
-3,800 |
|
Profit or loss in €² |
8,413 |
6,245 |
2,775 |
-2,429 |
-2,862 |
-3,296 |
|
Profit or loss in £² |
7,408 |
5,498 |
2,444 |
-2,138 |
-2,520 |
-2,902 |
|
Profit or loss in C$² |
13,629 |
10,116 |
4,496 |
-3,934 |
-4,637 |
-5,339 |
- 1.00 lot is equivalent of 10 000 units
- Calculations for exchange rate used as of 14:00 (GMT) 20/11/2025
There is a possibility to use Stop-Loss and Take-Profit
- You may wish to consider closing your position in profit, even if it is lower than the suggested one.
- Trailing stop technique could protect the profit