GOLD weekly special report based on 1.00 Lot Calculation:
GEOPOLITICS: MIDDLE EAST
- EVENT (EXPECTED: THURSDAY, FEBRUARY 26): U.S. - IRAN THIRD ROUND OF TALKS IN GENEVA (SWITZERLAND). According to Iran’s foreign minister and Oman, the 3rd round of Iran-US talks is due on Thursday 26th, again in Geneva. If the talks break down, or if a military escalation between the US and Iran happens in the meantime it could prove supportive for Gold, following higher geopolitical tensions.
- BREAKING (FEBRUARY): U.S. MILITARY BUILD-UP INTENSIFIES IN INTERNATIONAL WATERS NEAR IRAN. The USS Gerald R. Ford aircraft carrier strike group has been redirected from the Caribbean and is expected to join the USS Abraham Lincoln in the Middle East likely by the end of February. This significantly increases U.S. military presence in the region and reinforces pressure on Iran amid ongoing diplomatic tensions.
GEOPOLITICS: RUSSIA-UKRAINE CONFLICT
- EVENT (EXPECTED: THURSDAY, FEBRUARY 26): RUSSIA-UKRAINE TALKS MAY RESUME ON THURSDAY IN GENEVA. Peace talks are expected to resume on Thursday in Geneva. Last week, two days of peace talks took place in Geneva, ending without a breakthrough, with President Volodymyr Zelenskiy accusing Moscow of delaying U.S. mediated efforts to end the four-year-old war.
EVENTS
- THURSDAY, FEBRUARY 26 AT 13:30 GMT: INITIAL JOBLESS CLAIMS. A higher-than-expected reading will signal a deteriorating situation in the labor market which could point to more interest rate cuts in the future, thus potentially supporting Gold. This data measures the number of individuals who filed for unemployment for the first time during the past week. The data for last week stands at 206.000.
- MONDAY, MARCH 2 AT 13:30 GMT: US ISM MANUFACTURING PURCHASING MANAGERS INDEX (PMI) (FEBRUARY). A lower-than-expected set of data could prove supportive for Gold because it will point to more interest rate cuts by the FED in the near future. This data shows the overall level of activity in the Manufacturing sector. The data for the previous month stands at 52.6.
- FRIDAY, MARCH 6 AT 13:30 GMT: US NON-FARM PAYROLLS AND UNEMPLOYEMNT RATE (FEBRUARY). One of the most important indicators in the US labor market, if it shows a deteriorating situation (high unemployment rates and low numbers of newly employed), it could prove supportive for Gold, because it will motivate the FED to cut interest rates in the near future. The number of newly employed was 130.000 last month.
PRICE ACTION
- GOLD PRICE HIT A NEW ALL-TIME HIGH ON JANUARY 28, 2026 ($5,597.41). Gold currently trades around $5,160, and if it fully recovers to its previous all-time high, it could see an upside of around $437. However, the price could also decline.
- ANALYSTS’ OPINION: Wells Fargo forecasts $6,100; Bank of America forecasts $6,000; Goldman Sachs forecasts $5,400; Morgan Stanley forecasts $5,700; UBS forecasts $6,200; JPMorgan forecasts $6,300; Deutsche Bank forecasts $6,000; Societe General forecasts $6,000.
TECHNICAL ANALYSIS AND PRICE ACTION:
- LONG-TERM TREND IS UP. The overall trend of gold is up (black trendline), with the trend accelerating since mid – August of 2025.
- SUPPORT AREA: $4,900 – $4,700. After the most recent downward price correction that took place in late January 2026, gold prices have found a support zone in the range between $4,900 and $4,700. However, it could also decline.
- GOLD MOVING ABOVE DAILY AVERAGES: Gold has been steadily moving above the 20 -, 50 – and 100-day moving averages, clearly pointing to an uptrend.
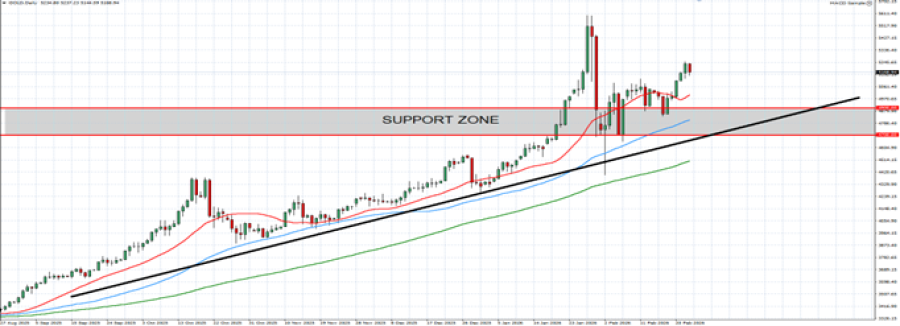
GRAPH (Daily): August 2025 – February 2026
Please note that past performance does not guarantee future results
GOLD, February 24, 2026
Current Price: 5,160
|
GOLD |
Weekly |
|
Trend direction |
|
|
6,000 |
|
|
5,600 |
|
|
5,400 |
|
|
4,930 |
|
|
4,900 |
|
|
4,860 |
Example of calculation base on weekly trend direction for 1.00 Lot1
|
GOLD |
||||||
|
Pivot Points |
||||||
|
Profit or loss in $ |
84,000 |
44,000 |
24,000 |
-23,000 |
-26,000 |
-30,000 |
|
Profit or loss in €2 |
71,263 |
37,328 |
20,361 |
-19,513 |
-22,058 |
-25,451 |
|
Profit or loss in £2 |
62,231 |
32,597 |
17,780 |
-17,040 |
-19,262 |
-22,226 |
|
Profit or loss in C$2 |
115,045 |
60,262 |
32,870 |
-31,500 |
-35,609 |
-41,087 |
- 1.00 lot is equivalent of 100 units
- Calculations for exchange rate used as of 11:00 (GMT) 24/02/2026
There is a possibility to use Stop-Loss and Take-Profit.
- You may wish to consider closing your position in profit, even if it is lower than suggested one.
- Trailing stop technique could protect the profit.