Crude Oil weekly special report based on 1.00 Lot Calculation:
TECHNICAL ANALYSIS:
- BREAKING (MAY 5): CRUDE OIL PRICES TESTED THE LEVEL OF $55.36. After testing the mark of $55.36, Crude oil prices managed to recover and hit $60.855 on May 9 (Data Source: MetaTarder 4).
- BREAKING (APRIL 9): CRUDE OIL PRICES HIT THEIR LOWEST LEVEL SINCE FEBRUARY 2021 ($55.115): Crude oil prices fell to their lowest in more than four years to hit the level of $55.115 on April 9. After testing the mark of $55.115, Crude oil prices managed to recover and hit $64.845 on April 23 (Data Source: MetaTarder 4).
- LONG-TERM SUPPORT AREA BELOW THE PSYCHOLOGICAL MARK OF $60: Crude oil price has recently tested levels below $60, which has been acting as a support area since early 2021.
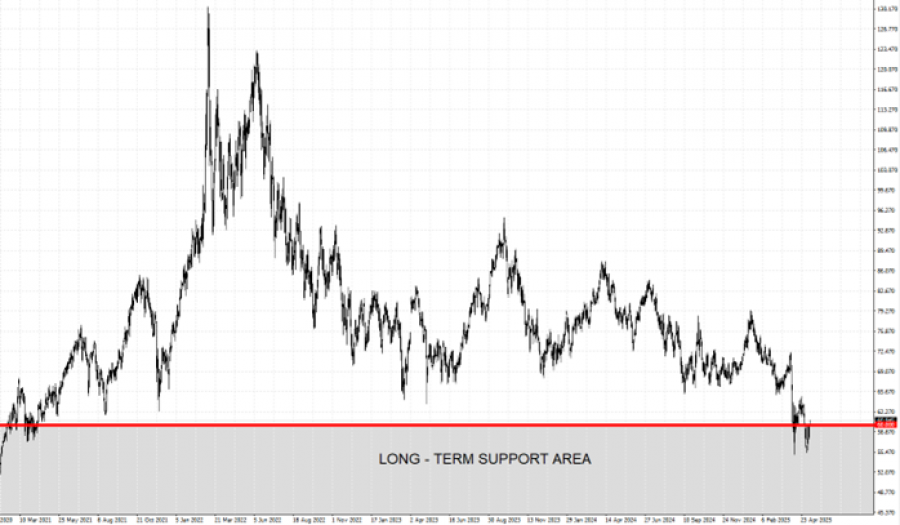
GRAPH (Daily): February 2021 – May 2025
Please note that past performance does not guarantee future results
GLOBAL TRADE:
- EVENT (SATURDAY, MAY 10): U.S.A. - CHINA TRADE TALKS TO BEGIN IN GENEVA, SWITZERLAND. U.S. Treasury Secretary Scott Bessent and chief trade negotiator Jamieson Greer will meet China's economic tsar He Lifeng in Switzerland this weekend for talks.
- BREAKING (MAY 8): U.S.A. AND U.K. ANNOUNCED A TRADE DEAL ON THURSDAY, MAY 8. President Trump said this is the first of many to follow.
GEOPOLITICS:
- MIDDLE EAST TENSIONS RISE: US PRESIDENT TRUMP THREATENED SECONDARY SANCTIONS ON COUNTRIES THAT BUY IRANIAN OIL. Meanwhile, Oman, which has mediated the latest rounds of nuclear talks between Iran and the USA, said there will be delays in talks.
- U.S.A. WITHDRAWS FROM UKRAINE - RUSSIA PEACE NEGOTIATIONS: President Donald Trump has withdrawn the United States from formal peace negotiations between Ukraine and Russia.
EVENTS (ECONOMIC DATA):
- SATURDAY, MAY 10, AT 02:30 GMT+1: CHINA INFLATION (CPI) (APRIL). China is the largest oil importer in the world and investors will continue watching data coming from China. In March, annual inflation came in negative -0.1%. If April data shows positive inflation, then the oil prices could see some upward pressure. Although, prices could fall, as well.
- TUESDAY, MAY 13, AT 13:30 GMT+1: US INFLATION (CPI) (APRIL): A lower-than-expected reading could be positive for gold, as it will motivate the FED to cut interest rates more aggressively. The CPI Index measures the change in the price of goods and services from the perspective of the consumer.
EVENTS (OIL):
- TUESDAY, MAY 13 AT 21:30 GMT+1: AMERICAN PETROLEUM INSTITUTE (API) WEEKLY OIL INVENTORY DATA (USA). If data showed a declining inventory for the past week, then positive support for the oil price could be expected. However, the price could decline.
- WEDNESDAY, MAY 14 AT 15:30 GMT+1: ENERGY INFORMATION ADMINISTRATION (EIA) OIL INVENTORY DATA (USA). If data showed a declining inventory for the past week, then positive support for the oil price could be expected. However, the price could decline.
Crude Oil, May 9, 2025
Current Price: 60.50
|
Crude Oil |
Weekly |
|
Trend direction |
UP |
|
Resistance 3 |
75.00 |
|
Resistance 2 |
70.00 |
|
Resistance 1 |
65.00 |
|
Support 1 |
56.50 |
|
Support 2 |
55.50 |
|
Support 3 |
55.00 |
Example of calculation based on weekly trend direction for 1.00 Lot1
|
Crude Oil |
||||||
|
Pivot Points |
Resistance 3 |
Resistance 2 |
Resistance 1 |
Support 1 |
Support 2 |
Support 3 |
|
Profit or loss in $ |
14,500 |
9,500 |
4,500 |
-4,000 |
-5,000 |
-5,500 |
|
Profit or loss in €² |
12,889 |
8,444 |
4,000 |
-3,556 |
-4,444 |
-4,889 |
|
Profit or loss in £² |
10,929 |
7,161 |
3,392 |
-3,015 |
-3,769 |
-4,146 |
|
Profit or loss in C$² |
20,177 |
13,219 |
6,262 |
-5,566 |
-6,958 |
-7,653 |
- 1.00 lot is equivalent of 1000 units
- Calculations for exchange rate used as of 10:00 (GMT+1) 09/05/2025
There is a possibility to use Stop-Loss and Take-Profit.
- You may wish to consider closing your position in profit, even if it is lower than the suggested one.
- Trailing stop techniques could protect the profit.