MICROSOFT (#MICROSOFT) weekly special report based on 1 Lot Calculation:
THE COMPANY:
- Microsoft is one of the world’s largest technological companies, focused on software, cloud computing, artificial intelligence, and enterprise solutions. Its core products include Windows, Office, Azure, and a rapidly expanding AI ecosystem.
- CLOUD COMPUTING AT THE CORE (AZURE): Microsoft Azure is one of the world’s top three cloud platforms, ranking second with around 20% global market share, behind AWS in first place and ahead of Google Cloud in third. Azure is a key growth driver for Microsoft, supported by strong demand for cloud infrastructure, data storage, and AI-related services.
- STOCK INDEX PARTICIPATION: Microsoft stock belongs to the three most important U.S. stock indices, including the NASDAQ 100 (USA100), S&P 500 (USA500), and Dow Jones Industrial Average (USA30).
MICROSOFT: RECENT FINANCIAL DATA
- BREAKING (WEDNESDAY, JANUARY 28): Q4 2025 EARNINGS REPORT. Microsoft reported strong Q4 results, with revenue of $81.27 billion (+17% annual increase), beating expectations of $80.32 billion. Net income reached $30.9 billion (+21% annual increase), also beating estimates of $29 billion and reflecting strong profitability in the quarter.
- AI AND CLOUD DRIVE GROWTH. Intelligent cloud revenue beat expectations, with Azure growing 39% year on year, confirming strong demand for AI and cloud services. Results highlight Microsoft’s solid growth momentum, strong margins, and continued leadership in cloud and AI infrastructure.
Source: Yahoo Finance
Please note that past performance does not guarantee future results
MICROSOFT: NEWS
- U.S. CLOUD COMPUTING MARKET EXPECTED TO SURGE. According to Yahoo Finance, the U.S. cloud computing market is projected to grow from $221.7 billion in 2024 to $871.6 billion by 2033, driven by a 16.4% compound annual growth rate (CAGR). As one of the leading cloud providers through Azure, Microsoft is well-positioned to capture a significant share of this growth, supporting long-term revenue and earnings expansion.
MICROSOFT: PRICE ACTION
- THE STOCK HIT AN ALL-TIME HIGH OF $560.61 (July 31, 2025). The stock price currently trades around $399, which indicates an upside potential of around 41% to reach the previous all-time high. Although the price could fall, too.
- ANALYSTS OPINION: JP Morgan 550; Citi forecasts $635; Goldman Sachs $600; Morgan Stanley $650; BMO Capital $575; Barclays $600; RBC Capital $640.
TECHNICAL ANALYSIS:
- SUPPORT AREA AT $400 - $370: The recent pullback has brought Microsoft back to a key support area between $400 and $370. In addition, the rising long-term trendline (black line) is converging with this area, reinforcing it as a major technical support level.
- OVERSOLD CONDITIONS (RSI): The 14-week Relative Strength Index (RSI) has dropped below the 30 level, suggesting that the stock is in oversold territory. This suggests that downward market pressure could be excessive in the short term, indicating a potential price recovery. However, the price could decline, too.
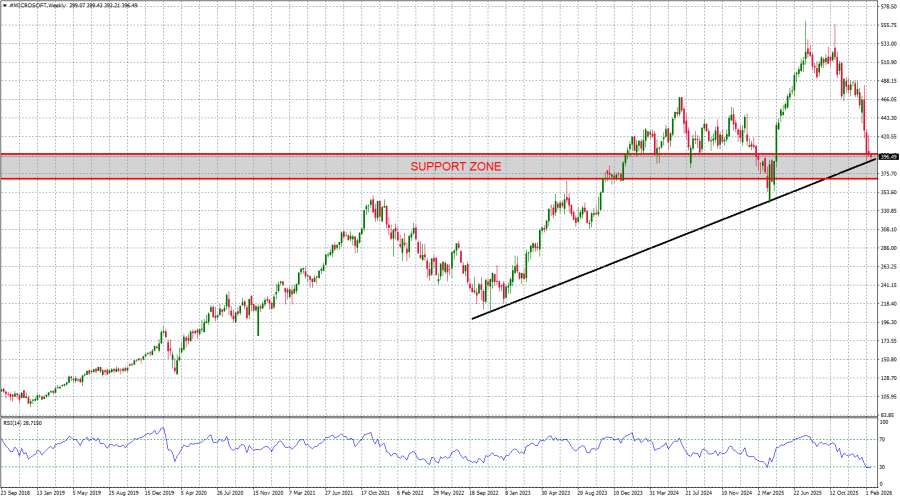
GRAPH (Weekly): September 2018 – February 2026
Please note that past performance does not guarantee future results
#MICROSOFT, February 19, 2026
Current Price: 399
|
Microsoft |
Weekly |
|
Trend direction |
|
|
500 |
|
|
460 |
|
|
430 |
|
|
370 |
|
|
360 |
|
|
350 |
Example of calculation based on weekly trend direction for 1.00 Lot1
|
Microsoft |
||||||
|
Pivot Points |
||||||
|
Profit or loss in $ |
101,000 |
61,000 |
31,000 |
-29,000 |
-39,000 |
-49,000 |
|
Profit or loss in €² |
85,600 |
51,699 |
26,273 |
-24,578 |
-33,054 |
-41,529 |
|
Profit or loss in £² |
74,831 |
45,195 |
22,968 |
-21,486 |
-28,895 |
-36,304 |
|
Profit or loss in C$² |
138,111 |
83,414 |
42,391 |
-39,656 |
-53,330 |
-67,005 |
- 1.00 lot is equivalent of 1000 units
- Calculations for exchange rate used as of 09:30 (GMT) 19/02/2026
There is a possibility to use Stop-Loss and Take-Profit
- You may wish to consider closing your position in profit, even if it is lower than the suggested one.
- Trailing stop technique could protect the profit