Crude Oil weekly special report based on 1.00 Lot Calculation:
GEOPOLITICS: MIDDLE-EAST
- EVENT (TUESDAY, FEBRUARY 17): US-IRAN NUCLEAR (INDIRECT) TALKS (ROUND 2) MEDIATED BY OMAN ENDED IN GENEVA (SWITZERLAND); IRAN CITED PROGRESS AND SOME AGREEMENTS ON PRINCIPALS; SOME US OFFICIALS SOUND SCEPTICAL. IRAN: WE WILL COME BACK IN THE NEXT TWO WEEKS WITH DETAILED PROPOSALS. USA: PROGRESS MADE, BUT STILL A LOT OF DETAILS TO BE DISCUSSED AS RED-LINES NOT WORKED THROUGH
IRANIAN OIL PRODUCTION AT RISK: Iran is one of the top three oil producers within OPEC, along with Saudi Arabia and Iraq, producing around 4 million barrels of oil per day, which is around 4% of total global supply.
IRAN OIL EXPORTS AT RISK: Iran exports around 1.7 million barrels of oil per day, predominantly to China.
STRAIT OF HORMUZ AT RISK: KEY OIL SUPPLY ROUTE. The Strait of Hormuz is a critical energy chokepoint through which around 20% of global crude oil demand passes, mainly from Saudi Arabia, Kuwait, and Iran. Rising tensions with Iran increase the risk that Tehran could attempt to block or disrupt traffic through the strait, which would significantly tighten global oil supply and add upside pressure to oil prices.
Source: Reuters, CNBC, Bloomberg
OTHER GEOPOLITICS: RUSSIA-UKRAINE CONFLICT
- EVENT (TUESDAY AND WEDNESDAY, FEBRUARY 17 - 18): PEACE TALKS BETWEEN UKRAINE AND RUSIA CONCLUDED WITHOUT BREAKTHROUGH: Two days of peace talks in Geneva between Ukraine and Russia ended on Wednesday without a breakthrough, with President Volodymyr Zelenskiy accusing Moscow of stalling U.S.-mediated efforts to end the four-year-old war. Trump has repeatedly pressured Ukraine to agree to a deal that could mean painful concessions, as Russian forces have pounded its power grid and advanced on the battlefield. Zelenskiy described the talks as "difficult."
Source: Reuters, CNBC, Bloomberg
OTHER EVENTS:
- THURSDAY, FEBRUARY 19 AT 17:00 GMT: ENERGY INFORMATION ADMINISTRATION (EIA) OIL INVENTORY DATA (USA). If data showed a declining inventory for the past week, then positive support for the oil price could be expected. However, the price could decline.
TECHNICAL ANALYSIS
- SUPPORT AREA: $55 - $60. According to the weekly chart below, crude oil has tested levels between $55 and $60 five times since 2021.
- BREAKING (DECEMBER 16, 2025): CRUDE OIL HAS TESTED ITS LOWEST RATE SINCE FEBRUARY 2021 ($54.865). The crude oil price has tested its lowest rate since February 2021. Currently, crude oil is trading above the $65 mark, floating above its longer-term support area between $55 and $60. However, it could also decline.
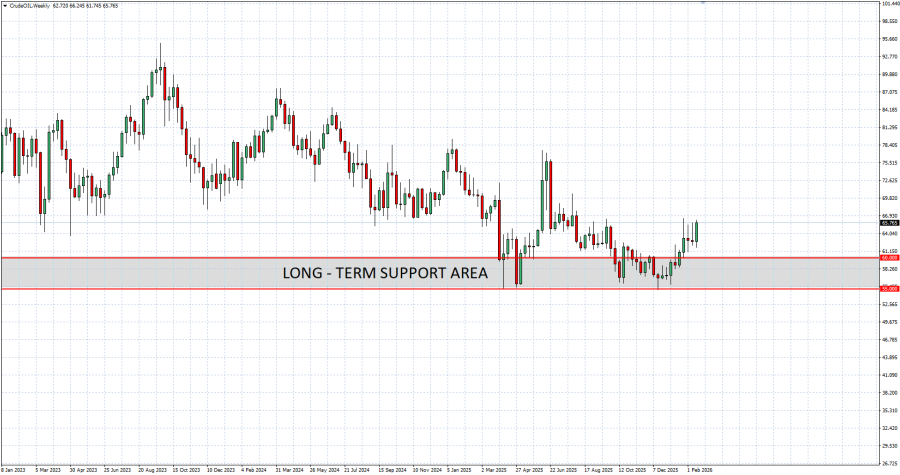
GRAPH (Weekly): April 2021 – February 2026
Please note that past performance does not guarantee future results
Crude Oil, February 19, 2026
Current Price: 65.50
|
Crude Oil |
Weekly |
|
Trend direction |
|
|
76.00 |
|
|
73.00 |
|
|
70.00 |
|
|
62.00 |
|
|
61.50 |
|
|
61.00 |
Example of calculation based on weekly trend direction for 1.00 Lot1
|
Crude Oil |
||||||
|
Pivot Points |
||||||
|
Profit or loss in $ |
10,500 |
7,500 |
4,500 |
-3,500 |
-4,000 |
-4,500 |
|
Profit or loss in €² |
8,897 |
6,355 |
3,813 |
-2,966 |
-3,389 |
-3,813 |
|
Profit or loss in £² |
7,778 |
5,556 |
3,334 |
-2,593 |
-2,963 |
-3,334 |
|
Profit or loss in C$² |
14,358 |
10,256 |
6,154 |
-4,786 |
-5,470 |
-6,154 |
1. 1.00 lot is equivalent of 1000 units
2. Calculations for exchange rate used as of 10:00 (GMT) 19/02/2026
There is a possibility to use Stop-Loss and Take-Profit.
- You may wish to consider closing your position in profit, even if it is lower than suggested one.
- Trailing stop technique could protect the profit.