Crude Oil weekly special report based on 1.00 Lot Calculation:
GEOPOLITICS:
- MIDDLE EAST TENSIONS ESCALATE: ISRAEL ATTACKED IRANIAN NUCLEAR FACILITIES ON FRIDAY (JUNE 13); IRAN VOWS RETALIATION. According to Reuters, Israel carried out strikes on Iran on Friday, targeting its nuclear facilities, ballistic missile factories and military commanders at the start of what it warned would be a prolonged operation to prevent Iran from building an atomic weapon. The Chief of Iranian Revolutionary Guards has been killed, while other top military officials and nuclear scientists also have been targeted.
- MIDDLE EAST REGION IS THE MOST IMPORTANT OIL SUPPLY VEIN IN THE WORLD RESPONSIBLE FOR AT LEAST 20% OF TOTAL SUPPLY IN THE WORLD. A full-scale war in the Middle East could threaten 5–15% of global output. The Strait of Hormuz, a vital transit route for nearly 20% of the world’s crude, lies at the heart of this risk. Any disruption there would have far more severe implications for energy markets than the shock seen in 2022 (Russia- Ukraine War).
- PRICE ACTION: CRUDE OIL ROSE BY AS MUCH AS 11.9% TO HIT ITS HIGHEST PRICE IN MORE THAN FOUR MONTHS ($77.565) ON REPORTS OF ISRAEL HAVING ATTACKED TARGETS IN IRAN (Data Source: MetaTrader 4 Platform)
ANALYST OPINION
- J.P. MORGAN: OIL PRICES COULD RISE TO $120 ON ESCALATING IRAN CONFLICT. According to the Economic Times, J.P. Morgan warned that oil prices could surge to as high as $120 per barrel if geopolitical tensions in the Middle East worsen further.
EVENTS (OIL):
- MONDAY, JUNE 16 AT 12:40 GMT+1: OPEC OIL MONTHLY REPORT. The group is expected to release fresh figures on supply and demand outlook in 2025.
- TUESDAY, JUNE 17 AT 09:00 GMT+1: INTERNATIONAL ENERGY AGENCY (IEA) OIL MONTHLY REPORT. The group is expected to release fresh figures on supply and demand outlook in 2025.
- TUESDAY, JUNE 17 AT 21:30 GMT+1: AMERICAN PETROLEUM INSTITUTE (API) WEEKLY OIL INVENTORY DATA (USA). If data showed a declining inventory for the past week, then positive support for the oil price could be expected. However, the price could decline.
- WEDNESDAY, JUNE 18 AT 15:30 GMT+1: ENERGY INFORMATION ADMINISTRATION (EIA) OIL INVENTORY DATA (USA). If data showed a declining inventory for the past week, then positive support for the oil price could be expected. However, the price could decline.
TECHNICAL ANALYSIS:
- 20- DAY AND 50- DAY MOVING AVERAGES INDICATES UPTREND: THE CRUDE OIL PRICE HAS REMAINED ABOVE THE 20-DAY AND 50- DAY MOVING AVERAGES (RED LINE AND BLIE) which are now sloping upward, indicating ongoing uptrend.
- 50- DAY MOVING AVERAGE INDICATES UPTREND: THE PRICE HAD MOVED ABOVE THE 50-DAY MOVING AVERAGE (BLUE LINE). The 50- day Moving Average is beginning to curve upward, indicating ongoing uptrend, as well.
- UPTREND SINCE EARLY MAY 2025: As depicted by the daily chart below, the crude oil price has kept trading above the mid-term green- lined uptrend line, confirming its mid-term trend is up.
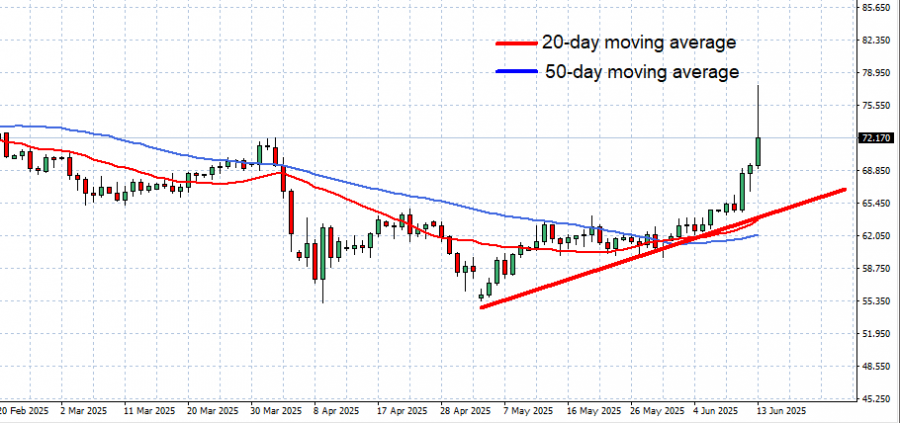
GRAPH (Daily): February 2025 – June 2025
Please note that past performance does not guarantee future results
Crude Oil, June 13, 2025
Current Price: 72.40
|
Crude Oil |
Weekly |
|
Trend direction |
|
|
85.00 |
|
|
80.00 |
|
|
77.00 |
|
|
68.00 |
|
|
66.50 |
|
|
65.00 |
Example of calculation based on weekly trend direction for 1.00 Lot1
|
Crude Oil |
||||||
|
Pivot Points |
||||||
|
Profit or loss in $ |
12,600 |
7,600 |
4,600 |
-4,400 |
-5,900 |
-7,400 |
|
Profit or loss in €² |
10,907 |
6,579 |
3,982 |
-3,809 |
-5,107 |
-6,406 |
|
Profit or loss in £² |
9,288 |
5,602 |
3,391 |
-3,243 |
-4,349 |
-5,455 |
|
Profit or loss in C$² |
17,159 |
10,350 |
6,265 |
-5,992 |
-8,035 |
-10,078 |
- 1.00 lot is equivalent of 1000 units
- Calculations for exchange rate used as of 09:33 (GMT+1) 13/06/2025
There is a possibility to use Stop-Loss and Take-Profit.
- You may wish to consider closing your position in profit, even if it is lower than the suggested one.
- Trailing stop techniques could protect the profit.