GASOLINE weekly special report based on 1.00 Lot Calculation:
GEOPOLITICS:
- MIDDLE EAST TENSIONS ESCALATE: ISRAEL ATTACKED IRANIAN NUCLEAR FACILITIES ON FRIDAY (JUNE 13); IRAN VOWS RETALIATION. According to Reuters, Israel carried out strikes on Iran on Friday, targeting its nuclear facilities, ballistic missile factories and military commanders at the start of what it warned would be a prolonged operation to prevent Iran from building an atomic weapon. The Chief of Iranian Revolutionary Guards has been killed, while other top military officials and nuclear scientists also have been targeted.
TECHNICAL ANALYSIS:
- LONG-TERM SUPPORT AREA BELOW THE PSYCHOLOGICAL MARK OF $2.000: Gasoline price has recently tested levels below $2.000, which has been acting as a support area since early 2021. However, there remains a risk of a potential breakout below this level if market conditions change.
- BREAKING (MAY 5): GASOLINE PRICES TESTED THE LEVEL OF $2.000. After testing the mark of $2.000, Gasoline prices managed to recover and hit $2.1938 on May 18 (Data Source: MetaTarder 4).
- BREAKING (SEPTEMBER 8, 2024): GASOLINE PRICES HIT THEIR LOWEST LEVEL SINCE FEBRUARY 2021 ($1,7064): Gasoline fell to their lowest in more than four years to hit the level of $1.7064 on September 8, 2024. After testing the mark of $1.7064, Gasoline price managed to recover and hit $2.247 on March 30 (Data Source: MetaTarder 4).
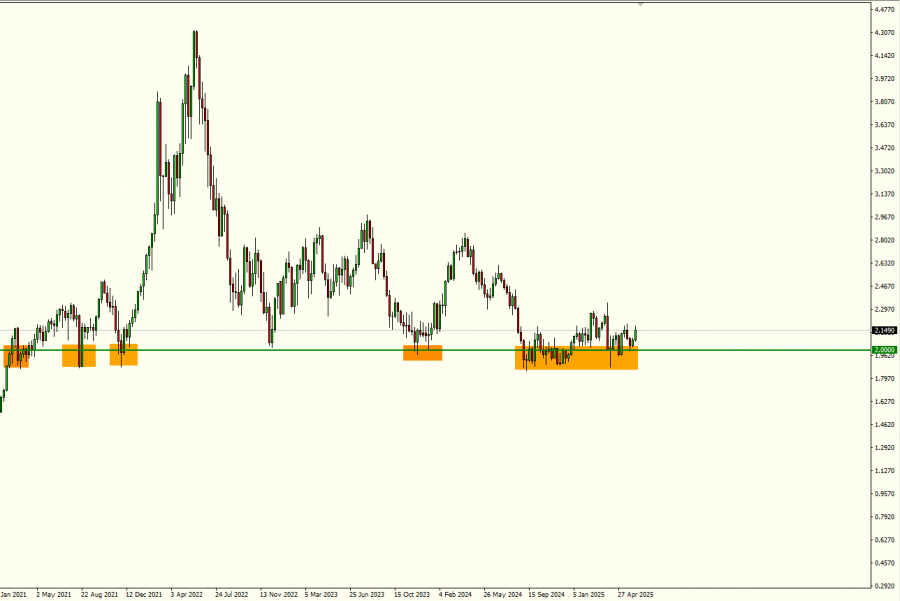
GRAPH (Weekly): February 2021 – June 2025
Please note that past performance does not guarantee future results
US DRIVING SEASON
- PERIOD: MEMORIAL DAY TO LABOUR DAY IN THE USA (MAY 26 TO SEPTEMBER 2). Usually that time period of the year sees higher oil and petroleum consumption and demand and more and more people in the US travel around. The period usually sees declining gasoline inventories in the US, due to higher consumption, signaling rising demand. This usually bodes well for gasoline prices, although prices could go into the opposite direction, as well.
EVENTS
- TUESDAY, JUNE 17 AT 21:30 GMT+1: AMERICAN PETROLEUM INSTITUTE (API) WEEKLY OIL AND GASOLINE INVENTORY DATA (USA). If data showed a declining inventory for the past week, then positive support for the gasoline price could be expected. However, the price could decline.
- WEDNESDAY, JUNE 18 AT 15:30 GMT+1: ENERGY INFORMATION ADMINISTRATION (EIA) OIL AND GASOLINE INVENTORY DATA (USA). If data showed a declining inventory for the past week, then positive support for the gasoline price could be expected. However, the price could decline.
GASOLINE June 13, 2025
Current Price: 2.2100
|
GASOLINE |
Weekly |
|
Trend direction |
|
|
2.5000 |
|
|
2.4000 |
|
|
2.3000 |
|
|
2.1300 |
|
|
2.1000 |
|
|
2.0700 |
Example of calculation base on weekly trend direction for 1.00 Lot1
|
GASOLINE |
||||||
|
Pivot Points |
||||||
|
Profit or loss in $ |
29,000 |
19,000 |
9,000 |
-8,000 |
-11,000 |
-14,000 |
|
Profit or loss in €2 |
25,138 |
16,470 |
7,802 |
-6,935 |
-9,535 |
-12,136 |
|
Profit or loss in £2 |
21,386 |
14,011 |
6,637 |
-5,899 |
-8,112 |
-10,324 |
|
Profit or loss in C$2 |
39,499 |
25,879 |
12,258 |
-10,896 |
-14,982 |
-19,068 |
- 1.00 lot is equivalent of 100,000 units
- Calculations for exchange rate used as of 09:00 (GMT+1) 13/06/2025
There is a possibility to use Stop-Loss and Take-Profit.
- You may wish to consider closing your position in profit, even if it is lower than suggested one.
- Trailing stop technique could protect the profit.