Natural Gas weekly special report based on 1.00 Lot Calculation:
GEOPOLITICS:
- MIDDLE EAST TENSIONS ESCALATE: ISRAEL ATTACKED IRANIAN NUCLEAR FACILITIES ON FRIDAY (JUNE 13); IRAN VOWS RETALIATION. According to Reuters, Israel carried out strikes on Iran on Friday, targeting its nuclear facilities, ballistic missile factories and military commanders at the start of what it warned would be a prolonged operation to prevent Iran from building an atomic weapon. The Chief of Iranian Revolutionary Guards has been killed, while other top military officials and nuclear scientists also have been targeted.
- RISING MIDDLE EAST TENSIONS THREATEN LNG (LIQUIFIED NATURAL GAS) ROUTES. A broader conflict involving Iran could also impact natural gas prices higher, particularly in Europe and Asia. Any disruption in LNG shipping routes through the Strait of Hormuz, or retaliatory attacks on energy infrastructure in the Gulf, could tighten global LNG supply.
TECHNICAL ANALYSIS:
- 100- WEEK AND 50- WEEK MOVING AVERAGES INDICATE UPTREND: NATURAL GAS PRICE HAS REMAINED ABOVE THE 100-WEEK AND 50- WEEK MOVING AVERAGES (BLUE AND BLACK LINES), indicating ongoing uptrend.
- UPTREND SINCE FEBRUARY 2024: As depicted by the weekly chart below, the natural gas price has kept trading above the mid-term green- lined uptrend line, confirming its mid-term trend is up.
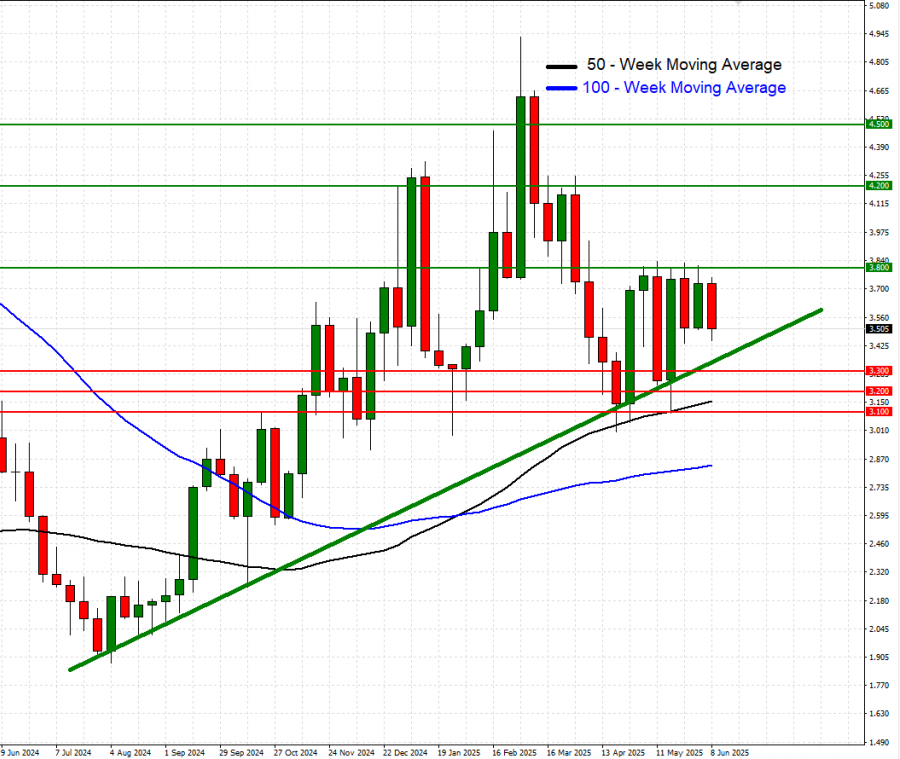
GRAPH (Weekly): February 2024 – June 2025
Please note that past performance does not guarantee future results
NATURAL GAS: PRICE ACTION
- NATURAL GAS PRICES HIT $9.972 IN AUGUST, 2022. Natural gas prices have risen due to Europe’s crisis and reduced Russian supply, boosting U.S. LNG demand. A rebound to $9.972 would represent a rise of approximately 185% from the current price of $3.5, though further declines cannot be ruled out.
Natural Gas, June 13, 2025
Current Price: 3.500
|
NATURAL GAS |
Weekly |
|
Trend direction |
|
|
4.500 |
|
|
4.200 |
|
|
3.800 |
|
|
3.300 |
|
|
3.200 |
|
|
3.100 |
Example of calculation based on weekly trend direction for 1.00 Lot1
|
NATURAL GAS |
||||||
|
Pivot Points |
||||||
|
Profit or loss in $ |
10,000 |
7,000 |
3,000 |
-2,000 |
-3,000 |
-4,000 |
|
Profit or loss in €² |
8,684 |
6,079 |
2,605 |
-1,737 |
-2,605 |
-3,474 |
|
Profit or loss in £² |
7,391 |
5,173 |
2,217 |
-1,478 |
-2,217 |
-2,956 |
|
Profit or loss in C$² |
13,613 |
9,529 |
4,084 |
-2,723 |
-4,084 |
-5,445 |
- 1.00 lot is equivalent of 10,000 units
- Calculations for exchange rate used as of 11:45 (GMT+1) 13/06/2025
There is a possibility to use Stop-Loss and Take-Profit.
- You may wish to consider closing your position in profit, even if it is lower than the suggested one.
- Trailing stop techniques could protect the profit.