CRUDE OIL Weekly Special Report based on 1 Lot Calculation:
TECHNICAL ANALYSIS:
- BREAKING (OCTOBER 17): CRUDE OIL PRICES HAVE TESTED THEIR LOWEST RATE SINCE MAY 2025 ($56.165).
- BREAKING (MAY 5): CRUDE OIL PRICES TESTED THE LEVEL OF $55.36. After testing the mark of $55.36, Crude oil prices managed to recover and hit $77.565 on June 13 (Data Source: MetaTrader 4).
- BREAKING (APRIL 9): CRUDE OIL PRICES HIT THEIR LOWEST LEVEL SINCE FEBRUARY 2021 ($55.115): Crude oil prices fell to their lowest in more than four years to hit the level of $55.115 on April 9. After testing the mark of $55.115, Crude oil prices managed to recover and hit $64.845 on April 23 (Data Source: MetaTrader 4).
- LONG-TERM SUPPORT AREA BELOW THE PSYCHOLOGICAL MARK OF $60: Crude oil price has recently tested levels below $60, which has been acting as a support area since early 2021.
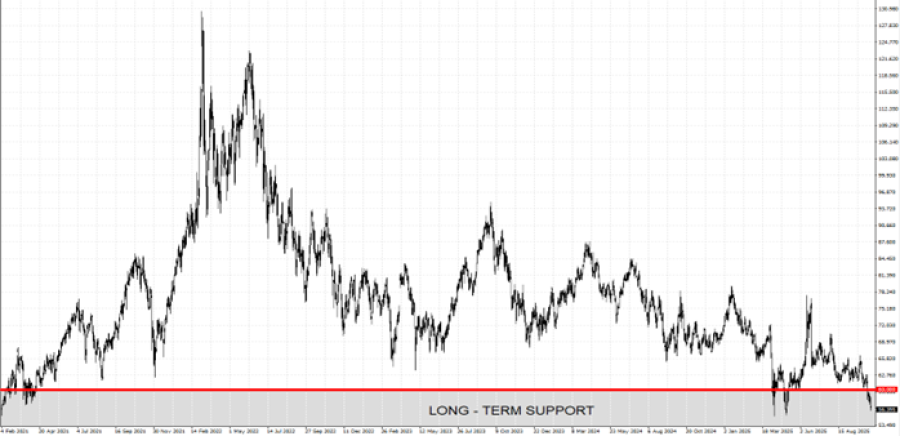
GRAPH (Daily): February 2021 – October 2025
Please note that past performance does not guarantee future results
GEOPOLITICS: UKRAINE – RUSSIA CONFLICT
- FRIDAY, OCTOBER 17 AT 18:00 GMT+1: U.S. PRESIDENT DONALD TRUMP MEETS UKRAINIAN PRESIDENT VOLODYMYR ZELENSKY. The White House meeting will focus on Ukraine’s request for advanced weaponry, including Tomahawk cruise missiles, amid rising tensions with Russia. Any escalation following this meeting could threaten Russian oil exports, potentially tightening the market and supporting higher oil prices.
GEOPOLITICS: CHINA – USA TRADE
- US PRESIDENT TRUMP AND CHINA PRESIDENT XI MEETING STILL ON TRACK TO TAKE PLACE (OCTOBER 31 – NOVEMBER 1): The meeting is expected to take place at the APEC (Asia-Pacific Economic Cooperation) Summit that will take place between October 31 and November 1 in South Korea. According to US Treasury Secretary Scot Bessent, the meeting between Trump and Xi is still expected to happen despite recent rise in trade tensions between the USA and China.
EVENTS (ECONOMIC DATA):
- MONDAY, OCTOBER 20 AT 3:00 GMT+1: CHINA GROSS DOMESTIC PRODUCT (GDP) (Q3). A stronger-than-expected GDP reading would indicate solid economic growth and rising industrial output, which could boost demand for oil. (PREVIOUS (Q2): +5.2%).
- MONDAY, OCTOBER 20 AT 3:00 GMT+1: CHINA INDUSTRIAL PRODUCTIION (SEPTEMBER). A stronger-than-expected industrial activity reading would indicate solid economic growth and rising industrial output, which could boost demand for oil. (PREVIOUS (August): +5.2%)
- FRIDAY, OCTOBER 24, AT 13:30 GMT+1: US INFLATION (CPI) (SEPTEMBER). Despite the ongoing US government shutdown, latest reports have said that US inflation data could still be released, with the office workers expected to work harder to get the data out. In August, US inflation rose to 2.90%, up from July’s 2.70%. This would be the last inflation report before the Fed’s interest rate decision on October 29.
Crude Oil, October 17, 2025.
Current Price: 56.20
|
Crude Oil |
Weekly |
|
Trend direction |
|
|
65.00 |
|
|
63.00 |
|
|
60.00 |
|
|
54.00 |
|
|
53.50 |
|
|
53.00 |
Example of calculation based on weekly trend direction for 1.00 Lot1
|
Crude Oil |
||||||
|
Pivot Points |
||||||
|
Profit or loss in $ |
8,800 |
6,800 |
3,800 |
-2,200 |
-2,700 |
-3,200 |
|
Profit or loss in €² |
7,520 |
5,811 |
3,247 |
-1,880 |
-2,307 |
-2,735 |
|
Profit or loss in £² |
6,561 |
5,070 |
2,833 |
-1,640 |
-2,013 |
-2,386 |
|
Profit or loss in C$² |
12,371 |
9,559 |
5,342 |
-3,093 |
-3,796 |
-4,499 |
- 1.00 lot is equivalent of 1000 units
- Calculations for exchange rate used as of 09:00 (GMT+1) 17/10/2025
There is a possibility to use Stop-Loss and Take-Profit.
- You may wish to consider closing your position in profit, even if it is lower than the suggested one.
- Trailing stop techniques could protect the profit.