Gasoline Weekly Special Report based On 1.00 Lot Calculation:
GEOPOLITICS: MIDDLE EAST WAR
- OPEC PRODUCTION DOWN AROUND 24.5% FROM THE GULF REGION
SUMMARY OF OIL PRODUCTION CUTS SO FAR IN THE REGION:
- SAUDI ARABIA: 2 to 2.5 million barrels a day of production cuts.
- IRAQ: 3.2 million barrels a day production cut.
- KUWAIT: 0.59 million barrels a day, but it may extend to 1.09 million barrels a day production cut.
- U.A.E.: around 0.7 million barrels a day production cut.
- BAHRAIN: Bahrain declared force majeure after the refinery attack, which was able to produce more than 200,000 barrels a day of oil.
- TOTAL OIL PRODUCTION CUTS: around 7 million barrels a day.
OPEC: THE CURRENT OIL PRODUCTION CUTS ARE EQUAL TO AROUND 24.5% OF TOTAL OPEC OIL PRODUCTION BEFORE THE WAR.
OPEC+: THE CURRENT OIL PRODUCTION CUTS ARE EQUAL TO AROUND 17% OF TOTAL OPEC+ OIL PRODUCTION BEFORE THE WAR.
GLOBAL SUPPLY: THE CURRENT OIL PRODUCTION CUTS ARE EQUAL TO AROUND 6-7% OF TOTAL GLOBAL SUPPLY.
Source: Bloomberg
MIDDLE EAST WAR: NEWS
- THE STRAIT OF HORMUZ REMAINS EFFECTIVELY “CLOSED”. More than 20 million barrels of oil used to pass through it on a daily basis before the war, which is more than 20% of total global demand. Qatar, which is responsible for around 20% of total Liquefied Natural Gas (LNG) exports in the world, also uses the Strait of Hormuz to export its LNG. All of that has gone down essentially to zero since the start of the war in the Middle East.
- IRAN: WE WILL NOT ALLOW “ONE LITER OF OIL” TO LEAVE THE REGION IF ATTACKS FROM THE U.S. CONTINUE. Iran's Revolutionary Guards said it would not allow "one liter of oil" to leave the region if attacks from the United States continue.
- BREAKING (MARCH 7): U.S. FORCES HIT AND DEMOLISHED OIL INFRASTRUCTURE, STORAGE, AND DEPOTS IN IRAN FOR FIRST TIME. According to Reuters, the US forces hit four oil storage facilities and an oil production transfer center in Tehran and the province of Alborz. The Aghdasieh oil warehouse in northeast Tehran, the Tehran refinery in the south, the Shahran oil depot in the west of Tehran, and an oil depot in Karaj city were the facilities targeted.
Source: Reuters, CNBC
TECHNICAL ANALYSIS
- DAILY MOVING AVERAGES CONFIRM POSITIVE MOMENTUM: The 50-day moving average (blue) is trending higher, indicating strengthening short-term momentum. The 100-day moving average (green) is also rising and remains below the current crude oil price, reinforcing the broader positive structure. With price trading above both moving averages, the overall sentiment remains positive. However, the price could also decline.
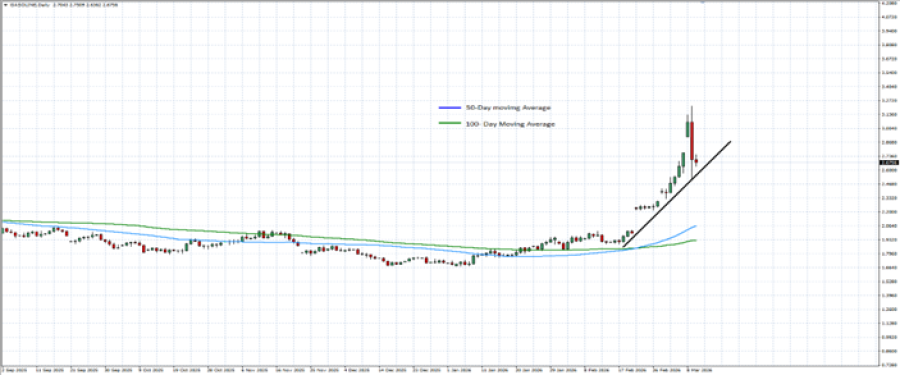
GRAPH (Daily): August 2025 – March 2026
Please note that past performance does not guarantee future results
Gasoline, March 10, 2026
Current Price: 2.640
|
Gasoline |
Weekly |
|
Trend direction |
|
|
4.320 |
|
|
3.500 |
|
|
3.000 |
|
|
2.300 |
|
|
2.200 |
|
|
2.100 |
Example of calculation base on weekly trend direction for 1.00 Lot1
|
GASOLINE |
||||||
|
Pivot Points |
||||||
|
Profit or loss in $ |
168,000 |
86,000 |
36,000 |
-34,000 |
-44,000 |
-54,000 |
|
Profit or loss in €2 |
144,181 |
73,807 |
30,896 |
-29,180 |
-37,762 |
-46,344 |
|
Profit or loss in £2 |
124,822 |
63,897 |
26,748 |
-25,262 |
-32,691 |
-40,121 |
|
Profit or loss in C$2 |
228,055 |
116,742 |
48,869 |
-46,154 |
-59,729 |
-73,303 |
1. 1.00 lot is equivalent of 100.000 units
2. Calculations for exchange rate used as of 9:30 (GMT) 10/3/2025
There is a possibility to use Stop-Loss and Take-Profit.
- You may wish to consider closing your position in profit, even if it is lower than suggested one.
- Trailing stop technique could protect the profit.