CRUDE OIL Weekly Special Report based on 1 Lot Calculation:
GEOPOLITICS: MIDDLE EAST WAR
- STRAIT OF HORMUZ IS EFFECTIVELY CLOSED:
Around 20 million barrels of oil per day are unable to reach global markets.
The latest attacks on ships mark an escalation in the conflict between Iran and the U.S. forces, raising the number of ships struck in the region since fighting began to at least 16.
Around 700 ships are stranded near the Strait of Hormuz, including about 400 oil tankers carrying roughly 200 million barrels of crude.
- CURRENT IMPACT: This represents ~20% of global oil demand, creating a major supply shock.
- SUPPLY LOSS ACCUMULATING: Over the last 16 days, since the war began, nearly 300 million barrels of oil exports have been disrupted.
- PRODUCTION SHUTDOWNS: 8-10 MILLION BARRELS OF OIL PER DAY. Approximately 8 to 10 million barrels per day of oil production has been stopped by several Gulf producers due to the conflict, including Saudi Arabia, Iraq, Kuwait, and the U.A.E.
Source: Reuters, CNBC, Bloomberg, OILPRICE.COM
MIDDLE EAST WAR: NEWS
- BREAKING (MARCH 16): FUJAIRAH OIL TRADING HUB IN U.A.E. TARGETED BY DRONES. Fujairah oil trading hub is one of the largest oil hubs in the world, with a storage capacity of around 115 million barrels and export of up to 1.7 million barrels a day.
- BREAKING (MARCH 13): U.S. FORCES HIT THE KHARG ISLAND (IRAN) OVER THE WEEKEND, AND U.S. PRESIDENT TRUMP SAID NEW ATTACKS ON KHARG COULD COME. According to Reuters, U.S. President Trump said the strikes, carried out Friday night, targeted military facilities and spared oil infrastructure. But he warned the United States could attack crude facilities on the island if Iran continues attacks on commercial vessels in the Strait of Hormuz.
IMPACT: The island, located about 24 km off the coast of mainland Iran in the northern Persian Gulf, handles roughly 90% of the country’s crude exports of nearly 2 million barrels a day of Iranian oil exports, which are mostly supplied to China.
Source: Reuters, CNBC, Bloomberg, OILPRICE.COM
PRICE ACTION: ANALYSTS’ OPINION
- BIG BANKS AND THEIR ESTIMATES IF THE CLOSURE OF THE HORMUTZ STRAIT PERSISTS:
JP MORGAN: $120
MORGAN STANLEY: $110
BARCLAYS: $100-$150
GOLDMAN SACHS: $100
UBS: $100-150
Source: Reuters, CNBC, Bloomberg, OILPRICE.COM
TECHNICAL ANALYSIS
- SUPPORT AREA: $80. After rising to its highest level since June 2022 ($119.40), crude oil prices have now found support around the $80 level or below. Since the war began, crude oil has surged about 77%, reaching prices not seen in almost four years and pushing the market firmly above $80.
- BREAKING (MARCH 9): CRUDE OIL PRICE HIT ITS HIGHEST RATE SINCE JUNE 2022 ($119.40). Crude oil price was last trading around $94, and if a full recovery to $119.40 follows, then crude oil prices may see an upside of around 27%. However, prices may decline as well.
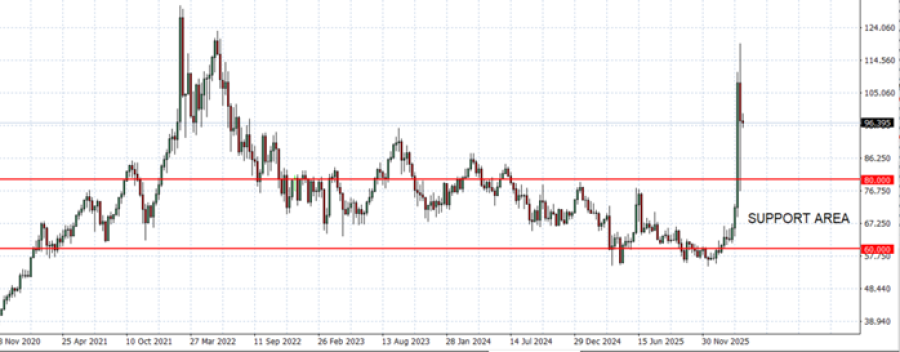
GRAPH (Weekly): November 2020 – March 2026
Please note that past performance does not guarantee future results
Crude Oil, March 16, 2026
Current Price: 94
|
Crude Oil |
Weekly |
|
Trend direction |
|
|
120 |
|
|
113 |
|
|
105 |
|
|
84 |
|
|
82 |
|
|
80 |
Example of calculation based on weekly trend direction for 1.00 Lot1
|
Crude Oil |
||||||
|
Pivot Points |
||||||
|
Profit or loss in $ |
26,000 |
19,000 |
11,000 |
-10,000 |
-12,000 |
-14,000 |
|
Profit or loss in €² |
22,657 |
16,557 |
9,586 |
-8,714 |
-10,457 |
-12,200 |
|
Profit or loss in £² |
19,580 |
14,308 |
8,284 |
-7,531 |
-9,037 |
-10,543 |
|
Profit or loss in C$² |
35,585 |
26,005 |
15,055 |
-13,687 |
-16,424 |
-19,161 |
- 1.00 lot is equivalent of 1000 units
- Calculations for exchange rate used a 13:00 (GMT) 16/3/2026
There is a possibility to use Stop-Loss and Take-Profit.
- You may wish to consider closing your position in profit, even if it is lower than the suggested one.
- Trailing stop techniques could protect the profit.