Gasoline Weekly Special Report based On 1.00 Lot Calculation:
GEOPOLITICS: MIDDLE EAST WAR
- STRAIT OF HORMUTZ IS EFFECTIVELY CLOSED:
Around 20 million barrels of oil per day unable to reach global markets.
The latest attacks on ships mark an escalation in the conflict between Iran and the U.S. forces, raising the number of ships struck in the region since fighting began to at least 16.
Around 700 ships are stranded near the Strait of Hormuz, including about 400 oil tankers carrying roughly 200 million barrels of crude.
- CURRENT IMPACT: This represents ~20% of global oil demand, creating a major supply shock.
- SUPPLY LOSS ACCUMULATING: Over the last 16 days, since the war began, nearly 300 million barrels of oil exports have been disrupted.
- PRODUCTION SHUT DOWNS: 8-10 MILLION BARRELS OF OIL PER DAY. Approximately 8 to 10 million barrels per day of oil production has been stopped by several Gulf producers due to the conflict, including Saudi Arabia, Iraq, Kuwait and U.A.E.
Source: Reuters, CNBC, Bloomberg, OILPRICE.COM
MIDDLE EAST WAR: NEWS
- BREAKING (MARCH 16): FUJAIRAH OIL TRADING HUB IN U.A.E. TARGETED BY DRONES. Fujairah oil trading hub is one of the largest oil hubs in the world with storage capacity of around 115 million barrels and export of up to 1.7 million barrels a day.
- BREAKING (MARCH 13): U.S. FORCES HIT THE KHARG ISLAND (IRAN) OVER THE WEEKEND AND U.S. PRESIDENT TRUMP SAID NEW ATTACKS ON KHARG COULD COME. According to Reuters, U.S. President Trump said the strikes, carried out Friday night, targeted military facilities and spared oil infrastructure. But he warned the United States could attack crude facilities on the island if Iran continues attacks on commercial vessels in the Strait of Hormuz.
IMPACT: The island, located about 24 km off the coast of mainland Iran in the northern Persian Gulf, handles roughly 90% of the country’s crude exports of nearly 2 million barrels a day of Iranian oil exports, which is mostly supplied to China.
- U.S. AND IRAN BOTH REFUSED NEGOTIATIONS AND A CEASEFIRE. Iran's Foreign Minister stated on live TV that Iran has never asked for a ceasefire or negotiations. Also, President Donald Trump's administration has rebuffed efforts by Middle Eastern allies to start diplomatic negotiations aimed at ending the Iran war.
- IRAN: WE WILL NOT ALLOW “ONE LITER OF OIL” TO LEAVE THE REGION IF ATTACKS FROM THE U.S. CONTINUE. Iran's Revolutionary Guards said it would not allow "one liter of oil" to leave the region if attacks from the United States continue.
Source: Reuters, CNBC, Bloomberg, OILPRICE.COM
TECHNICAL ANALYSIS
- DAILY MOVING AVERAGES CONFIRM POSITIVE TREND: The 50-day moving average (blue) is trending higher, indicating strengthening short-term momentum. The 100-day moving average (green) is also rising and remains below the current price, reinforcing the broader positive structure. With price trading above both moving averages, the overall sentiment remains positive. However, the price could also decline.
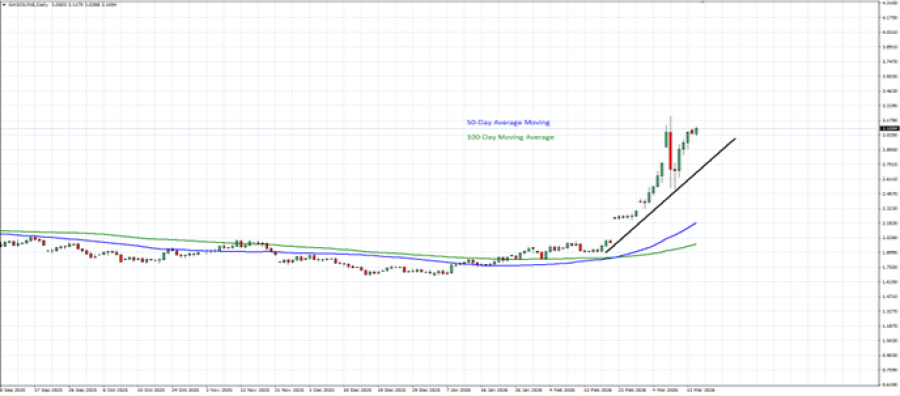
GRAPH (Daily): September 2025 – March 2026
Please note that past performance does not guarantee future results
Gasoline, March 16, 2026
Current Price: 3.027
|
Gasoline |
Weekly |
|
Trend direction |
|
|
4.320 |
|
|
3.800 |
|
|
3.300 |
|
|
2.760 |
|
|
2.700 |
|
|
2.600 |
Example of calculation base on weekly trend direction for 1.00 Lot1
|
GASOLINE |
||||||
|
Pivot Points |
||||||
|
Profit or loss in $ |
129,300 |
77,300 |
27,300 |
-26,700 |
-32,700 |
-42,700 |
|
Profit or loss in €2 |
112,706 |
67,380 |
23,796 |
-23,273 |
-28,503 |
-37,220 |
|
Profit or loss in £2 |
97,448 |
58,258 |
20,575 |
-20,123 |
-24,645 |
-32,181 |
|
Profit or loss in C$2 |
177,035 |
105,838 |
37,379 |
-36,557 |
-44,772 |
-58,464 |
- 1.00 lot is equivalent of 100.000 units
- Calculations for exchange rate used as of 11:00 (GMT) 16/3/2026
There is a possibility to use Stop-Loss and Take-Profit.
- You may wish to consider closing your position in profit, even if it is lower than suggested one.
- Trailing stop technique could protect the profit.