GOLD weekly special report based on 1.00 Lot Calculation:
GEOPOLITICS: MIDDLE EAST WAR
- MIDDLE EAST WAR ENTERS ITS THIRD WEEK. The conflict between the U.S. and Iran has intensified, with sustained airstrikes on Iranian military targets and continued missile and drone attacks by Iran on U.S. bases and allied infrastructure across the Gulf. Iran has refused ceasefire negotiations while the U.S. continues large-scale military operations. According to U.S. officials, the conflict could continue for weeks as military pressure increases.
- GLOBAL UNCERTAINTY AND RISING SYSTEMIC RISK. The escalation of the war has significantly increased geopolitical uncertainty and volatility across global markets. Attacks on military bases, shipping routes and energy infrastructure, combined with the closure of key maritime routes such as the Strait of Hormuz, have increased fears of a broader regional conflict. This environment of elevated geopolitical risk and economic uncertainty is increasing investor demand for defensive positioning across global financial markets.
EVENTS
- WEDNESDAY, MARCH 18 AT 18:00 GMT: US FEDERAL RESERVE INTEREST RATE DECISION. PRESS CONFERENCE AT 18:30 GMT. The bank is expected to keep rates unchanged at 3.75%. The bank is also expected to address the U.S.–Iran war’s impact on its monetary policy going forward. The Fed is expected to release updated economic forecasts for GDP growth, inflation, unemployment, and the interest rate path for 2026, 2027, and 2028, which could drive volatility across financial markets, including gold.
PRICE ACTION
- GOLD PRICE HIT A NEW ALL-TIME HIGH ON JANUARY 28, 2026 ($5,597.41). Gold currently trades around $5,020, and if it fully recovers to its previous all-time high, it could see an upside of around $577. However, the price could also decline.
- ANALYSTS’ OPINION: Wells Fargo forecasts $6,100; Bank of America forecasts $6,000; Goldman Sachs forecasts $5,400; Morgan Stanley forecasts $5,700; UBS forecasts $6,200; JPMorgan forecasts $6,300; Deutsche Bank forecasts $6,000; Societe General forecasts $6,000.
TECHNICAL ANALYSIS
- LONG-TERM TREND IS UP. The overall trend in gold remains upward, as indicated by the black trendline on the chart. The positive sentiment has strengthened significantly since mid-August 2025.
- SUPPORT AREA: $5,100 – $5,000. Gold prices have found a support zone in the range between $5,100 and $5,000. However, it could also decline.
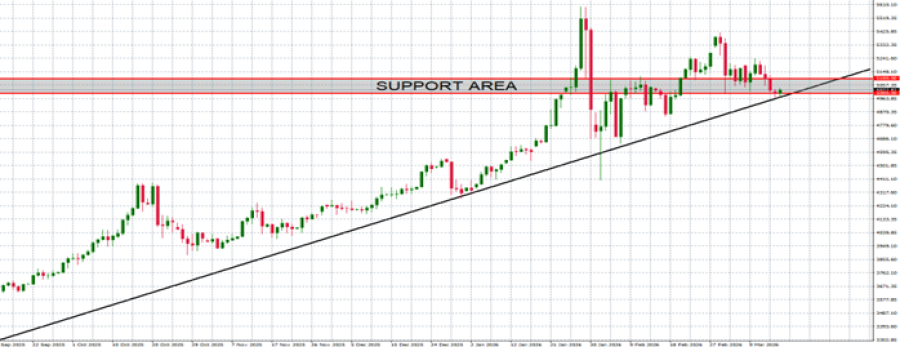
GRAPH (Daily): September 2025 – March 2026
Please note that past performance does not guarantee future results
GOLD, March 16, 2026
Current Price: 5,020
|
GOLD |
Weekly |
|
Trend direction |
|
|
5,600 |
|
|
5,400 |
|
|
5,200 |
|
|
4,900 |
|
|
4,850 |
|
|
4,800 |
Example of calculation base on weekly trend direction for 1.00 Lot1
|
GOLD |
||||||
|
Pivot Points |
||||||
|
Profit or loss in $ |
58,000 |
38,000 |
18,000 |
-12,000 |
-17,000 |
-22,000 |
|
Profit or loss in €2 |
50,539 |
33,112 |
15,684 |
-10,456 |
-14,813 |
-19,170 |
|
Profit or loss in £2 |
43,672 |
28,613 |
13,554 |
-9,036 |
-12,801 |
-16,565 |
|
Profit or loss in C$2 |
79,341 |
51,982 |
24,623 |
-16,415 |
-23,255 |
-30,095 |
- 1.00 lot is equivalent of 100 units
- Calculations for exchange rate used as of 13:20 (GMT) 16/03/2026
There is a possibility to use Stop-Loss and Take-Profit.
- You may wish to consider closing your position in profit, even if it is lower than suggested one.
- Trailing stop technique could protect the profit.