Special Report: Crude Oil
Date: February 7, 2024
CRUDE OIL: TECHNICAL ANALYSIS
CHART (SHORT- TERM)
- STRONG SUPPORT AT $70: The Crude Oil Daily Chart illustrates how strong the $70 support level has been over the short run. The chart below describes how the Crude Oil price has behaved from October 2023 to present day.
- SUPPORT OF $70 TESTED 5 TIMES OVER THE PAST 4 MONTHS: The same chart also shows that Crude Oil has respected the support level of $70 as its price has tested the level five times in total over the past 4 months. After testing the level of $70, Crude Oil quickly moved upwards to establish and strengthen its position above the level of $70.
- MOVING WITHIN THE $70- $80 PRICE CHANNEL: In addition to efforts to stay above the mark of $70, the chart below also shows us that in the period between October 2023 and present day, Crude Oil spent almost all of its time within the channel between $70 and $80.
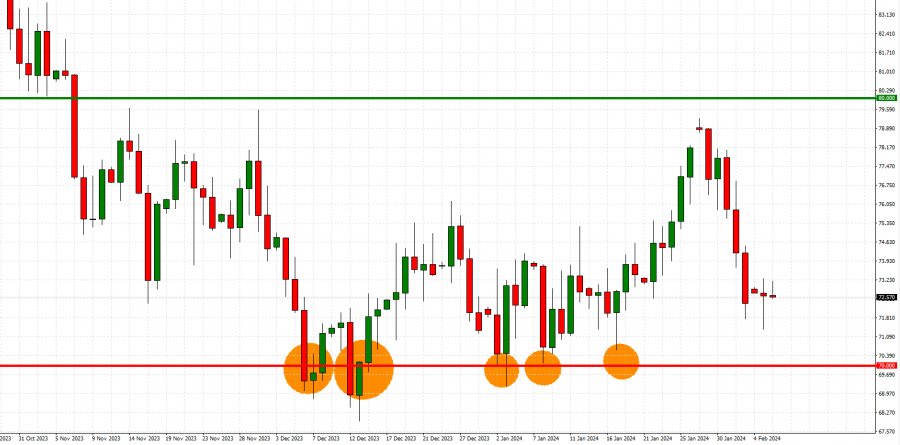
Daily Chart (October 2023- February 2024)
Please note that past performance does not guarantee future results.
CHART (LONG- TERM):
- STRONG SUPPORT AT $70: The Crude Oil Daily Chart intends to illustrate how strong the $70 support level has ALSO been over the longer run. The chart below describes how the Crude Oil price has behaved from November 2021 to present day.
- SUPPORT OF $70 TESTED 9 TIMES] OVER THE PAST 26 MONTHS: The same chart shows that Crude Oil has respected the support level of $70 over a longer period as well, as its price has tested the level nine times in total over the past 26 months. After testing the level of $70, Crude Oil quickly moves upwardly to establish and strengthen its position above the level of $70.
- MOVING WITHIN THE $70- $80 PRICE CHANNEL: In addition to efforts to stay above the mark of $70, the chart below also shows us that in the period between November 2021 and present day, Crude Oil would spend most of its time within the channel between $70 and $80. There were a few exceptions when the Crude Oil price jumped to around $130 (when the Russia- Ukraine war broke out in early 2022) and when the Crude Oil fell to $63.66 in April 2023.
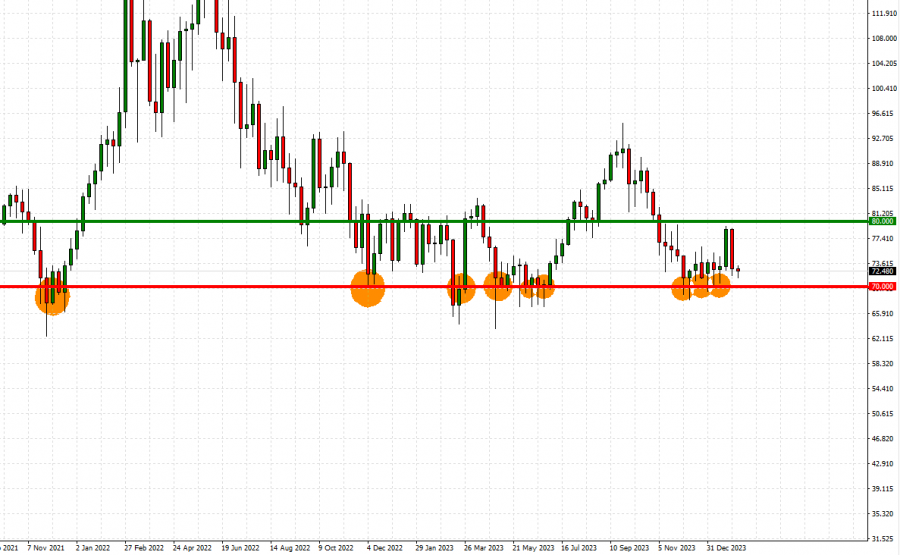
Weekly Chart (November 2021- February 2024)
Please note that past performance does not guarantee future results.