GASOLINE weekly special report based on 1.00 Lot Calculation:
TECHNICAL ANALYSIS:
- UPTREND CHANNEL SINCE MAY 2025: The daily chart below depicts the black-lined uptrend channel, which uptrend has been in place since May 2025. With this uptrend, the gasoline price has recently tested the highest level since early April 2025
- MOVING AVERAGE GOLDEN CROSS: The daily chart below also shows that the faster 20- Day Moving Average (Blue) has recently crossed above the slower 50- Day and 100 -Day Moving Averages (Red and Green, respectively), performing a Golden Cross, indicating a positive momentum, which could support the ongoing uptrend. In addition, gasoline price currently sits above all of the three important daily moving averages, which itself indicates positive sentiment. Although, the sentiment could change should gasoline prices fall below the 20, 50, or 100-day moving averages.
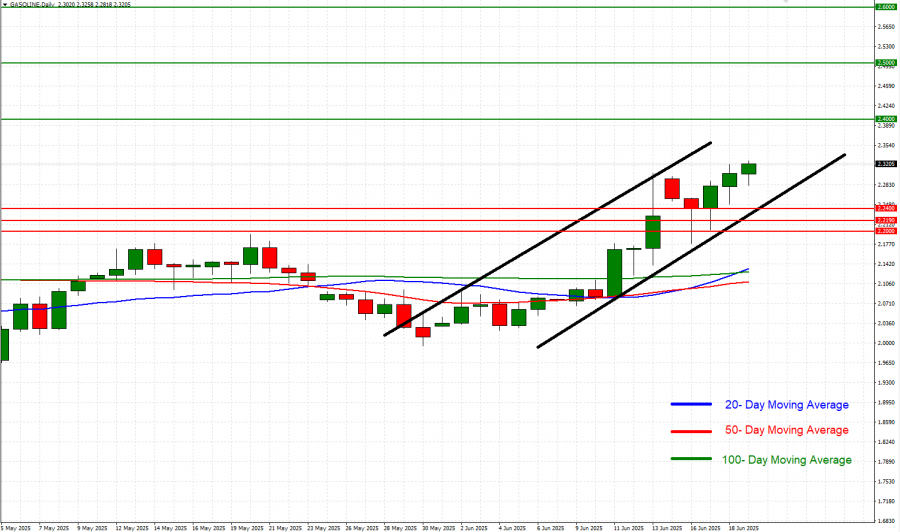
GRAPH (Daily): May 2025 – June 2025
Please note that past performance does not guarantee future results
US DRIVING SEASON
- PERIOD: MEMORIAL DAY TO LABOUR DAY IN THE USA (MAY 26 TO SEPTEMBER 2). Usually that time period of the year sees higher oil and petroleum consumption and demand and more and more people in the US travel around. The period usually sees declining gasoline inventories in the US, due to higher consumption, signaling rising demand. This usually bodes well for gasoline prices, although prices could go into the opposite direction, as well.
GEOPOLITICS:
- MIDDLE EAST TENSIONS RISE: ISRAEL – IRAN CONFLICT CONTINUED THIS WEEK. Israel has carried out strikes on Iran, targeting its nuclear facilities, ballistic missile factories and petroleum and gas fields. On the other hand, Iranian missiles have struck Israel as it has been the case since Friday (June 13) night.
- SHIPPING LINES THROUGH HORMUZ STRAIT COME UNDER RISK. Iran has publicly considered blocking or interfering with traffic through the Strait of Hormuz, a critical artery for global energy supplies.
- MIDDLE EAST REGION IS THE MOST IMPORTANT OIL SUPPLY VEIN IN THE WORLD RESPONSIBLE FOR AT LEAST 20% OF TOTAL SUPPLY IN THE WORLD. The Strait of Hormuz, a vital transit route for nearly 20% of the world’s oil, lies at the heart of this risk. Any disruption there would have far more severe implications for energy markets than the shock seen in 2022 (Russia- Ukraine War).
EVENTS
- TUESDAY, JUNE 24 AT 21:30 GMT+1: AMERICAN PETROLEUM INSTITUTE (API) WEEKLY OIL AND GASOLINE INVENTORY DATA (USA). If data showed a declining inventory for the past week, then positive support for the gasoline price could be expected. However, the price could decline.
- WEDNESDAY, JUNE 25 AT 15:30 GMT+1: ENERGY INFORMATION ADMINISTRATION (EIA) OIL AND GASOLINE INVENTORY DATA (USA). If data showed a declining inventory for the past week, then positive support for the gasoline price could be expected. However, the price could decline.
GASOLINE June 19, 2025
Current Price: 2.3150
|
GASOLINE |
Weekly |
|
Trend direction |
|
|
2.6000 |
|
|
2.5000 |
|
|
2.4000 |
|
|
2.2400 |
|
|
2.2190 |
|
|
2.2000 |
Example of calculation base on weekly trend direction for 1.00 Lot1
|
GASOLINE |
||||||
|
Pivot Points |
||||||
|
Profit or loss in $ |
28,500 |
18,500 |
8,500 |
-7,500 |
-9,600 |
-11,500 |
|
Profit or loss in €2 |
24,859 |
16,136 |
7,414 |
-6,542 |
-8,373 |
-10,031 |
|
Profit or loss in £2 |
21,256 |
13,798 |
6,339 |
-5,594 |
-7,160 |
-8,577 |
|
Profit or loss in C$2 |
39,106 |
25,385 |
11,663 |
-10,291 |
-13,173 |
-15,780 |
- 1.00 lot is equivalent of 100,000 units
- Calculations for exchange rate used as of 10:30 (GMT+1) 19/06/2025
There is a possibility to use Stop-Loss and Take-Profit.
- You may wish to consider closing your position in profit, even if it is lower than suggested one.
- Trailing stop technique could protect the profit.