Natural Gas weekly special report based on 1.00 Lot Calculation:
GEOPOLITICS:
- MIDDLE EAST TENSIONS RISE: ISRAEL – IRAN CONFLICT CONTINUED THIS WEEK. Israel has carried out strikes on Iran, targeting its nuclear facilities, ballistic missile factories and petroleum and gas fields. On the other hand, Iranian missiles have struck Israel as it has been the case since Friday (June 13) night.
- QATAR LNG (Liquified Natural Gas) EXPORTS (UP TO 20% OF TOTAL LNG EXPORTS WORLDWIDE) COULD BE JEOPARDIZED DUE TO POTENTIAL CLOSURE OF THE HORMUZ STRAIT BY IRAN. Qatar is among the top three largest LNG exporters in the world. Most of the exports go through the Hormuz Strait, which is being reviewed by Iran to shut down due to the ongoing conflict with Israel and the USA. Qatar sends more than 70% of its Liquefied Natural Gas (LNG) exports to Asia and 25% to Europe, according to Kpler tanker tracking data. Qatar sends 77 million tons of LNG every year through the Strait of Hormuz to customers. This is up to 20% of total LNG exports worldwide.
- QATARENERGY LNG INSTRUCTS LNG (Liquified Natural Gas) TANKERS TO WAIT OUTSIDE THE STRAIT OF HORMUZ BEFORE LOADING. QatarEnergy LNG is the world's largest producer of LNG, with a liquefaction capacity of 77 million tons per year, according to Rigzone. According to Reuters, QatarEnergy has instructed tankers to remain outside the Strait of Hormuz and to enter the Gulf only the day before loading, amid military strikes between nearby Iran and Israel.
TECHNICAL ANALYSIS:
- 50- DAY AND 20 - DAY MOVING AVERAGES INDICATE UPTREND: The Natural Gas price has traded above the 20-day and 50- day moving averages, indicating an ongoing uptrend.
- SHORT-TERM UPTREND SINCE MAY 2025: As depicted by the daily chart below, the natural gas price has kept trading above the short-term black- lined uptrend line, confirming its short-term trend is up.
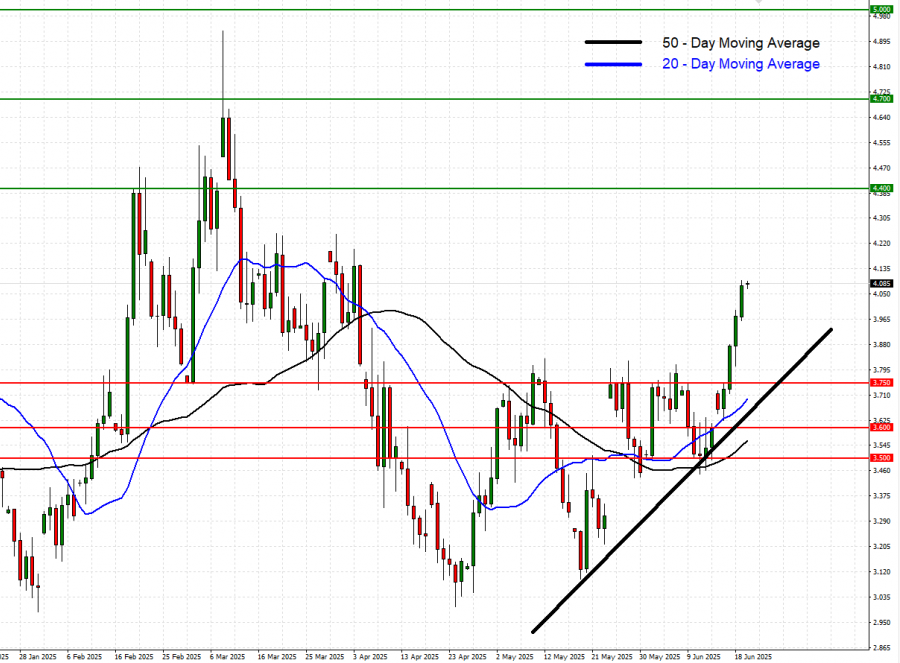
GRAPH (Daily): January 2025 – June 2025
Please note that past performance does not guarantee future results
Natural Gas, June 20, 2025
Current Price: 4.070
|
NATURAL GAS |
Weekly |
|
Trend direction |
|
|
5.000 |
|
|
4.700 |
|
|
4.400 |
|
|
3.750 |
|
|
3.600 |
|
|
3.500 |
Example of calculation based on weekly trend direction for 1.00 Lot1
|
NATURAL GAS |
||||||
|
Pivot Points |
||||||
|
Profit or loss in $ |
9,300 |
6,300 |
3,300 |
-3,200 |
-4,700 |
-5,700 |
|
Profit or loss in €² |
8,077 |
5,472 |
2,866 |
-2,779 |
-4,082 |
-4,951 |
|
Profit or loss in £² |
6,902 |
4,676 |
2,449 |
-2,375 |
-3,488 |
-4,230 |
|
Profit or loss in C$² |
12,744 |
8,633 |
4,522 |
-4,385 |
-6,441 |
-7,811 |
- 1.00 lot is equivalent of 10,000 units
- Calculations for exchange rate used as of 09:00 (GMT+1) 20/06/2025
There is a possibility to use Stop-Loss and Take-Profit.
- You may wish to consider closing your position in profit, even if it is lower than the suggested one.
- Trailing stop techniques could protect the profit.