GOLD weekly special report based on 1.00 Lot Calculation:
GEOPOLITICS: US TAX CUT BILL
- EVENT (EXPECTED BY JULY 4): U.S. SENATE IS EXPECTED TO SOON VOTE ON TRUMP’S TAX CUT BILL AS U.S. PRESIDENT TRUMP PRESSURES LAWMAKERS TO DO IT BY JULY 4. The president is pressuring his party to pass the sweeping tax cuts and spending package in time for him to sign it by the 4TH of July. Reminder, Trump’s Republicans hold a majority of 53-47 in the U.S. Senate.
- ANALYSTS’ OPINION: The bill is expected to provide tax cuts of around 3.8 trillion dollars, and provide the US the possibility to increase their debt by another, near, 4 trillion dollars. The measure has been putting negative pressure on the US dollar, which in turn provides support to the gold prices.
EVENTS:
- TUESDAY, JULY 1, AT 14:30 GMT+1: FEDERAL RESERVE CHAIR JEROME POWELL SPEAKS (SINTRA, PORTUGAL). On Tuesday (July 1), Mr. Powell will join Bank of Japan Governor Ueda, Bank of England Governor Bailey and ECB President Lagarde on a policy panel.
- THURSDAY, JULY 3, AT 13:30 GMT+1: US NON-FARM PAYROLL (NFP) AND UNEMPLOYEMENT RATE (JUNE). A lower than expected result should prove positive for Gold, because it could point to the further FED interest rate cuts. This data measures the change in the number of people emplyed during the previous month, excluding the farming industry. The data for the previous month came in at 139,000, which was lower than for the month before (147,000).
TECHNICAL ANALYSIS:
- SUPPORT AREA BETWEEN $3,300 AND $3,200: Gold prices have seen near-term support at $3,300, and an extended support level at $3,200, meaning the area between $3,300 and $3,200 altogether acts as a near-term support area.
- LONG–TERM UPTREND: As depicted by the daily chart below, the gold price has kept trading above the long-term dark blue uptrend line, confirming its long-term trend is up. However, there remains a risk of a potential breakout below this level if market conditions change.
- 100- DAY MOVING AVERAGE POINTS TO AN UPTREND: The 100-Day Moving Average continued to point to an uptrend as the gold price has remained steady above it.
- GOLD HIT A NEW ALL-TIME HIGH OF $3,499.76 (April 22, 2025): Gold has traded around $3,345, and if a full recovery takes place, the price of Gold could rise around $155. Although the price could decline as well.
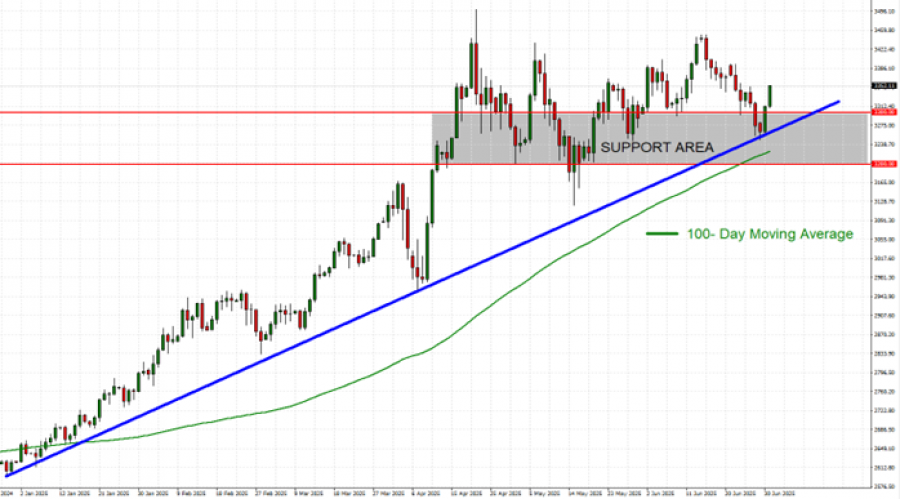
GRAPH (Daily): January 2025 – July 2025
Please note that past performance does not guarantee future results
GOLD, JULY 1, 2025
Current Price: 3,345
|
GOLD |
Weekly |
|
Trend direction |
|
|
3,500 |
|
|
3,450 |
|
|
3,400 |
|
|
3,295 |
|
|
3,270 |
|
|
3,250 |
Example of calculation base on weekly trend direction for 1.00 Lot1
|
GOLD |
||||||
|
Pivot Points |
||||||
|
Profit or loss in $ |
15,500 |
10,500 |
5,500 |
-5,000 |
-7,500 |
-9,500 |
|
Profit or loss in €2 |
13,124 |
8,891 |
4,657 |
-4,234 |
-6,351 |
-8,044 |
|
Profit or loss in £2 |
11,272 |
7,636 |
4,000 |
-3,636 |
-5,454 |
-6,909 |
|
Profit or loss in C$2 |
21,097 |
14,292 |
7,486 |
-6,806 |
-10,208 |
-12,930 |
- 1.00 lot is equivalent of 100 units
- Calculations for exchange rate used as of 13:10 (GMT+1) 01/07/2025
There is a possibility to use Stop-Loss and Take-Profit.
- You may wish to consider closing your position in profit, even if it is lower than suggested one.
- Trailing stop technique could protect the profit.