USD/JPY Weekly Special Report based on 1.00 Lot Calculation:
GEOPOLITICS: TRADE PROGRESS
- JAPAN – U.S. TRADE TALKS CONTINUE: Japan- US preliminary trade talks began on April 16, and President Trump hailed big progress. Talks will continue. A deal is expected to be reached by July 9th, when Trump’s tariff deadline expires.
EVENTS:
- TUESDAY, JULY 1, AT 14:30 GMT+1: US FEDERAL RESERVE CHAIR JEROME POWELL AND CHRISTINE LAGARD WILL SPEAK IN SINTRA (PORTUGAL) AT ECB (European Central Bank) FORUM. On Tuesday (July 1), Mr. Powell will join Bank of Japan Governor Ueda, Bank of England Governor Bailey and ECB President Lagarde on a policy panel.
- THURSDAY, JULY 3, AT 13:30 GMT+1: US NONFARM PAYROLLS (NFP) AND UNEMPLOYMENT RATE (JUNE). If the NFP figures come in lower than the expected, or the unemployment rate beats expectations, the U.S. dollar could weaken, putting downward pressure on USD/JPY.
TEHNICAL ANALYSIS:
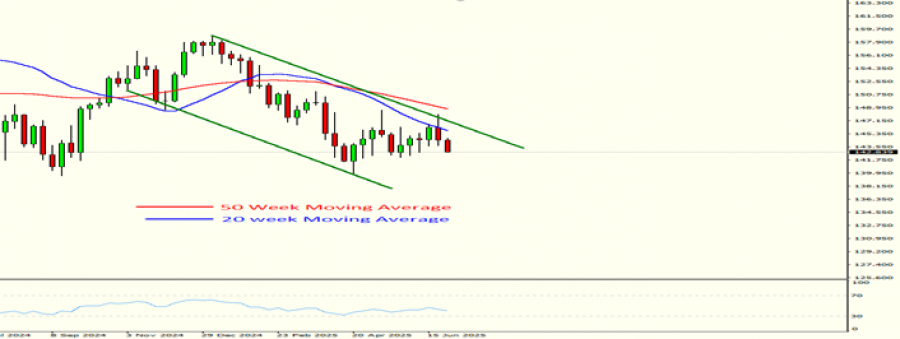
- DOWNTREND CHANNEL: As depicted by the weekly chart below, the USDJPY has kept trading within the longer-term green- lined downtrend channel, confirming its longer-term trend is down.
- WEEKLY MOVING AVERAGES POINT TO DOWNTREND: USDJPY have recently traded below the 20- and 50- Week Moving Averages, pointing to an ongoing downtrend. However, USDJPY can also change their trend, if prices rise above the 20- and 50- Week Moving Averages.
- 14- WEEK RELATIVE STRENGTH INDEX (RSI) STAYS BELOW 50: The chart below shows that the 14- week relative strength index (RSI) remains in downtrend, floating below the break-even point of 50, towards the limit of 30.
GRAPH (Weekly): Jun 2024 – June 2025
Please note that past performance does not guarantee future results
USDJPY, JULY 1, 2025
Current Price: 142.90
|
USD/JPY |
Weekly |
|
Trend direction |
|
|
144.50 |
|
|
144.20 |
|
|
144.00 |
|
|
141.50 |
|
|
141.00 |
|
|
140.50 |
Example of calculation based on weekly trend direction for 1.00 Lot1
|
USD/JPY |
||||||
|
Pivot Points |
||||||
|
Profit or loss in $ |
-1,119 |
-909 |
-770 |
979 |
1,329 |
1,679 |
|
Profit or loss in €² |
-947 |
-770 |
-651 |
829 |
1,125 |
1,421 |
|
Profit or loss in £² |
-813 |
-660 |
-559 |
711 |
965 |
1,219 |
|
Profit or loss in C$² |
-1,522 |
-1,237 |
-1,047 |
1,332 |
1,808 |
2,284 |
- 1.00 lot is equivalent of 100.000 units
- Calculations for exchange rate used as of 10:55 (GMT+1) 01/07/2025
There is a possibility to use Stop-Loss and Take-Profit.
- You may wish to consider closing your position in profit, even if it is lower than suggested one.
- Trailing stop technique could protect the profit.