GOLD weekly special report based on 1.00 Lot Calculation:
STATISTICS (2025):
- STATISTICS (2025): GOLD HAS UNDERGONE 17 DOWNWARD CORRECTIONS IN 2025, FOLLOWED BY PRICE RECOVERIES TO PREVIOUS TOPS.
- AVERAGE NUMBER OF DAYS NEEDED TO RECOVER TO PREVIOUS TOP: 6
- CURRENT: THE CURRENT DOWNWARD CORRECTION IS THE 18TH THIS YEAR. Since October 20, 2025, gold has lost around $495 after testing $3,886.37 on October 28, 2025.
- TECHNICAL SUPPORT: $4,000 - $3,900. Over the past few days, after the most recent decline in gold prices, gold has tried to maintain near-term support area between $4,000 and $3,900.
- GOLD HIT AN ALL-TIME HIGH OF $4,381.34 (October 20, 2025): Gold has traded last around $4,084, and if a full recovery to its recent all-time high takes place, then gold could see an upside potential of around $300. Despite the recent price correction, gold is still up more than 55% since the beginning of 2025.
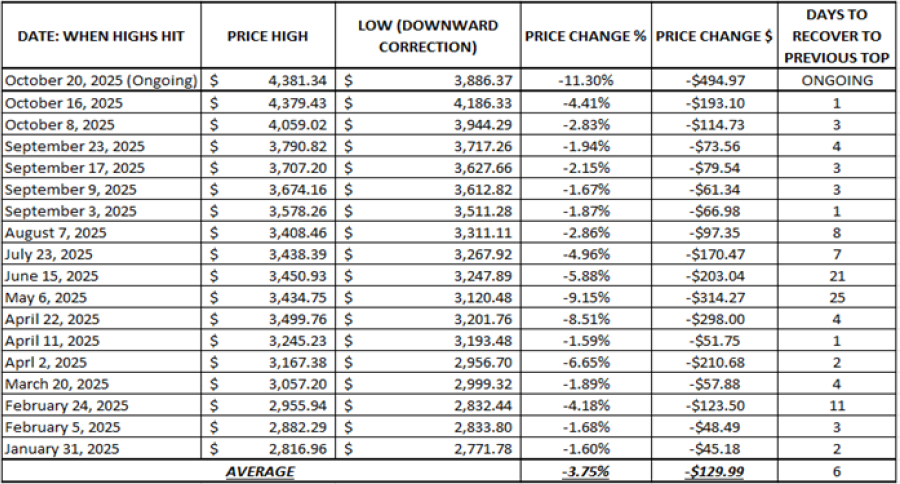
Data Source: Meta Trader 4
Please note that past performance does not guarantee future results
US FEDERAL RESERVE:
- BREAKING (OCTOBER 29): US FEDERAL RESERVE CUT INTEREST RATE TO 4.00% FROM 4.25%. The Fed cut rates again in October after the one earlier in September. In total, this year, rates have fallen from 4.50% to the current 4.00%.
- NEXT: DECEMBER 10: The US Federal Reserve is expected to finish the year 2025 by cutting the rates to 3.75% on December 10.
EVENTS
- WEDNESDAY, NOVEMBER 19 AT 19:00 GMT: US FEDERAL RESERVE OPEN MARKET COMIMITTEE (FOMC) MEETING MINUTES. If a rate cut by the FED is signaled in the minutes, it could prove positive for Gold. Given uncertainty over the FED’s December interest rate decision, these meeting minutes could prove pivotal in anticipating the FED’s next interest rate maneuver. The meeting minutes offer detail insights regarding the FOMC’s stance on monetary policy.
- THURSDAY, NOVEMBER 20 AT 13:30 GMT: US NON-FARM PAYROLLS (SEPTEMBER) (UNCONFIRMED): Following the economic data delay during the US government shutdown, non-farm payroll data could come out on Thursday. If this data comes out worse than expected, it could create upward pressure for Gold, because the FED will be motivated to cut interest rates in December. Non-farm payrolls measure the change in the number of people employed during the previous month, excluding the farming industry. The data for August came out lower than expected at 22,000.
PRICE ACTION:
- ANALYSTS’ OPINION: Bank of America forecasts $5,000; Societe Generale forecasts $5,000; Standard Chartered forecasts $4,500; Goldman Sachs forecasts $4,900; J.P. Morgan forecasts $5,055; Morgan Stanley forecasts $4,400; HSBC forecasts $5,000.
GOLD, November 17, 2025.
Current Price: 4,084
|
GOLD |
Weekly |
|
Trend direction |
|
|
4,700 |
|
|
4,500 |
|
|
4,250 |
|
|
3,950 |
|
|
3,900 |
|
|
3,850 |
Example of calculation base on weekly trend direction for 1.00 Lot1
|
GOLD |
||||||
|
Pivot Points |
||||||
|
Profit or loss in $ |
61,600 |
41,600 |
16,600 |
-13,400 |
-18,400 |
-23,400 |
|
Profit or loss in €2 |
53,101 |
35,860 |
14,310 |
-11,551 |
-15,861 |
-20,171 |
|
Profit or loss in £2 |
46,780 |
31,592 |
12,606 |
-10,176 |
-13,973 |
-17,770 |
|
Profit or loss in C$2 |
86,394 |
58,344 |
23,282 |
-18,794 |
-25,806 |
-32,819 |
- 1.00 lot is equivalent of 100 units
- Calculations for exchange rate used as of 10:00 (GMT) 17/11/2025
There is a possibility to use Stop-Loss and Take-Profit.
- You may wish to consider closing your position in profit, even if it is lower than suggested one.
- Trailing stop technique could protect the profit.