GOLD weekly special report based on 1.00 Lot Calculation:
GEOPOLITICS:
- EVENT (TUESDAY, FEBRUARY 17): US–IRAN INDIRECT NUCLEAR TALKS (ROUND 2) TO CONTINUE IN GENEVA, MEDIATED BY OMAN. This follows the first round of indirect talks held in Oman on February 6. According to Reuters, Iran and the U.S. are seeking a deal that could deliver economic benefits for both sides. The U.S. delegation, led by envoys Steve Witkoff and Jared Kushner, will meet Iranian officials in Geneva. US President Trump will also indirectly be involved in the negotiations. Tehran reiterated that 0% uranium enrichment is not acceptable and its ballistic missile program is not up for negotiation.
- EVENT (TUESDAY AND WEDNESDAY, FEBRUARY 17 - 18): ANOTHER ROUND OF A TRI-LATERAL SUMMIT BETWEEN THE USA, UKRAINE AND RUSSIA TO TAKE PLACE IN GENEVA (SWITZERLAND). The previous talks of the trilateral working groups in Abu Dhabi, capital of the UAE, on January 23-24 and February 4-5, did not bring any breakthrough solutions. The main sticking point is the long-term fate of territory in eastern Ukraine, large parts of which Russia has occupied. Moscow is demanding that Kyiv pull its troops out of swaths of the Donbas, including heavily fortified cities that sit atop vast natural resources, as a condition of any deal.
CHINA: CHINA CONTINUED BUYING GOLD FOR 15 CONSECUTIVE MONTHS IN JANUARY 2026
- CHINA GOLD RESERVES UP TO 74.19 MILLION OUNCES IN JANUARY 2026, 15 MONTHS IN A ROW OF PURCHASES. China has managed to increase its gold reserves from 74.15 million ounces in December to a new, 74.19 million ounces in January 2026. This is their 15th consecutive increase in gold reserves on a monthly basis.
EVENTS
- WEDNESDAY, FEBRUARY 18 AT 19:00 GMT: FEDERAL RESERVE (FOMC) MEETING MINUTES. Investors will closely analyze the Fed’s latest meeting minutes for clues on future rate cuts. Any discussion showing concern about growth or the labor market could reinforce expectations of further easing, which could support gold prices.
- FRIDAY, FEBRUARY 20 AT 13:30 GMT: U.S. GROSS DOMESTIC PRODUCT (GDP) (Q4). U.S. GDP is expected at 2.8%, following 4.4% in the previous quarter. A weaker than expected reading would signal slowing economic momentum and strengthen expectations for Fed rate cuts, a backdrop that typically supports gold prices.
PRICE ACTION
- GOLD PRICE HIT A NEW ALL-TIME HIGH ON JANUARY 28, 2026 ($5,597.41). Gold currently trades around $4,925, and if it fully recovers to its previous all-time high, it could see an upside of around $670. However, the price could also decline.
- ANALYSTS’ OPINION: Wells Fargo forecasts $6,100; Bank of America forecasts $6,000; Goldman Sachs forecasts $5,400; Morgan Stanley forecasts $5,700; UBS forecasts $6,200; JPMorgan forecasts $6,300; Deutsche Bank forecasts $6,000; Societe General forecasts $6,000.
TECHNICAL ANALYSIS AND PRICE ACTION:
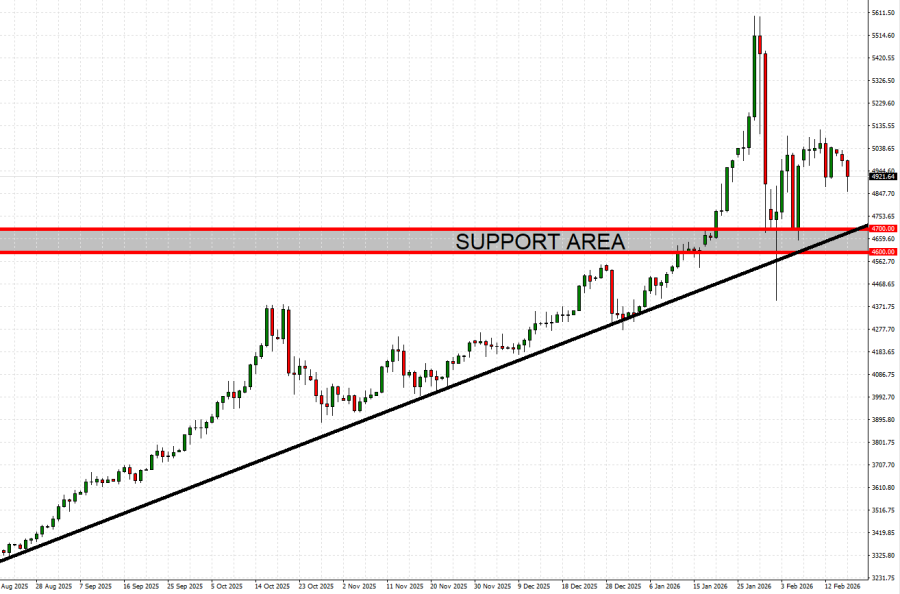
- LONG-TERM TREND IS UP. The overall trend of gold is up (black trendline), with the trend accelerating since mid – August of 2025.
- SUPPORT AREA: $4,700 – $4,600. After the most recent downward price correction that took place in late January 2026, gold prices have found a support zone in the range between $4,700 and $4,600. However, it could also decline.
GRAPH (Daily): August 2025 – February 2026
Please note that past performance does not guarantee future results
GOLD, February 17, 2026
Current Price: 4,925
|
Current Price: |
4,925 |
|
GOLD |
Weekly |
|
Trend direction |
|
|
5,700 |
|
|
5,500 |
|
|
5,200 |
|
|
4,700 |
|
|
4,650 |
|
|
4,600 |
Example of calculation base on weekly trend direction for 1.00 Lot1
|
GOLD |
||||||
|
Pivot Points |
||||||
|
Profit or loss in $ |
77,500 |
57,500 |
27,500 |
-22,500 |
-27,500 |
-32,500 |
|
Profit or loss in €2 |
65,448 |
48,558 |
23,223 |
-19,001 |
-23,223 |
-27,446 |
|
Profit or loss in £2 |
57,056 |
42,332 |
20,246 |
-16,565 |
-20,246 |
-23,927 |
|
Profit or loss in C$2 |
105,733 |
78,447 |
37,518 |
-30,697 |
-37,518 |
-44,340 |
1. 1.00 lot is equivalent of 100 units
2. Calculations for exchange rate used as of 11:00 (GMT) 17/02/2026
There is a possibility to use Stop-Loss and Take-Profit.
- You may wish to consider closing your position in profit, even if it is lower than suggested one.
- Trailing stop technique could protect the profit.