MICROSOFT (#MICROSOFT) weekly special report based on 1 Lot Calculation:
THE COMPANY:
- Microsoft is one of the world’s largest technological companies, focused on software, cloud computing, artificial intelligence, and enterprise solutions. Its core products include Windows, Office, Azure, and a rapidly expanding AI ecosystem.
- CLOUD COMPUTING AT THE CORE (AZURE): Microsoft Azure is one of the world’s top three cloud platforms, ranking second with around 20% global market share, behind AWS in first place and ahead of Google Cloud in third. Azure is a key growth driver for Microsoft, supported by strong demand for cloud infrastructure, data storage, and AI-related services.
- STOCK INDEX PARTICIPATION: Microsoft stock belongs to the three most important U.S. stock indices, including the NASDAQ 100 (USA100), S&P 500 (USA500), and Dow Jones Industrial Average (USA30).
MICROSOFT: EVENTS
- EVENT (WEDNESDAY, JANUARY 28, AFTERMARKET): Q4 2025 EARNINGS REPORT. Microsoft is expected to report $80.309 billion in revenue for Q4 2025, representing a 15.3% increase from the same period last year ($69.632 billion). The company is also expected to post net income of $29.051 billion, up around 20.4% year-on-year compared with $24.131 billion in the same quarter last year.
- QUARTERLY REVENUE AND NET INCOME (LAST 8 QUARTERS). Microsoft has beaten revenue and Net Income expectations 8 out of the last 8 times.
- LAST TIME (Q3 RESULTS): Microsoft reported higher-than-expected revenue ($77.673 billion, an increase of around 20%) and better than expected net income ($28.199 billion, an increase of around 13%) compared with the same period last year.
- CONSISTENT EARNINGS BEATS. Microsoft has beaten expectations in both revenue and net income in each of the last 11 quarterly results, highlighting strong consistent outperformance versus market forecasts.
Source: Bloomberg Terminal
Please note that past performance does not guarantee future results
MICROSOFT: NEWS
- U.S. CLOUD COMPUTING MARKET EXPECTATIONS. According to Yahoo Finance, the U.S. cloud computing market is projected to grow from $221.7 billion in 2024 to $871.6 billion by 2033, driven by a 16.4% compound annual growth rate (CAGR). As one of the leading cloud providers through Azure, Microsoft is well positioned to capture a significant share of this growth, supporting long-term revenue and earnings expansion.
TECHNICAL ANALYSIS:
- SUPPORT AREA AT $450 - $430: The recent pullback has brought Microsoft back to a key support area between $450 and $430, which previously acted as resistance and is now turning into support.
- THE STOCK HIT AN ALL-TIME HIGH OF $560.61 (July 31, 2025). The stock price currently trades around $451, which indicates an upside potential of around 24% to reach previous all-time high. Although, the price could fall, too.
- ANALYSTS OPINION: Wells Fargo forecasts $665, Citi forecasts $690, Goldman Sachs $655, Morgan Stanley $650.
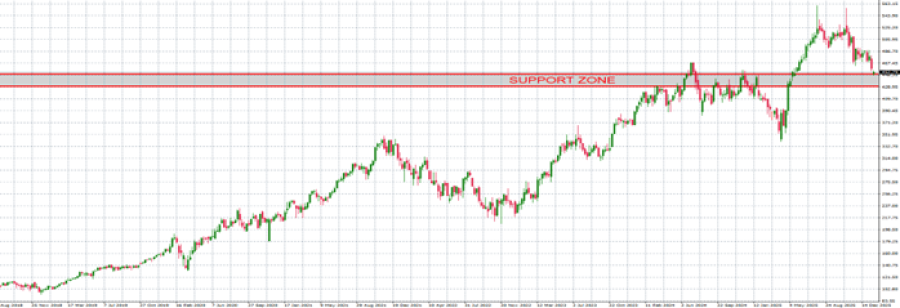
GRAPH (Weekly): August 2018 – January 2026
Please note that past performance does not guarantee future results
#MICROSOFT, January 21, 2026
Current Price: 451
|
Microsoft |
Weekly |
|
Trend direction |
|
|
560 |
|
|
520 |
|
|
485 |
|
|
420 |
|
|
410 |
|
|
400 |
Example of calculation based on weekly trend direction for 1.00 Lot1
|
Microsoft |
||||||
|
Pivot Points |
||||||
|
Profit or loss in $ |
109,000 |
69,000 |
34,000 |
-31,000 |
-41,000 |
-51,000 |
|
Profit or loss in €² |
92,863 |
58,785 |
28,966 |
-26,411 |
-34,930 |
-43,450 |
|
Profit or loss in £² |
81,200 |
51,402 |
25,329 |
-23,094 |
-30,543 |
-37,993 |
|
Profit or loss in C$² |
150,343 |
95,171 |
46,896 |
-42,758 |
-56,551 |
-70,344 |
- 1.00 lot is equivalent of 1000 units
- Calculations for exchange rate used as of 12:00 (GMT) 21/01/2026
There is a possibility to use Stop-Loss and Take-Profit
- You may wish to consider closing your position in profit, even if it is lower than the suggested one.
- Trailing stop technique could protect the profit