Natural Gas weekly special report based On 1 Lot Calculation:
FUNDAMENTAL FACTORS:
- US PRODUCTION CUTS: U.S. marketed natural gas production averaged 110 billion cubic feet per day (Bcf/d) in May, a 3% decrease from 1Q24. The decline in output underscores the commitment of some of the biggest energy companies, like Chesapeake, Antero Resources, and Coterra Energy, to execute their production reduction plans for the year.
- US LNG EXPORT INCREASE: U.S. exports of liquefied natural gas (LNG) rebounded in May as Freeport LNG, the country's second-largest exporter of the superchilled gas, returned to full production and as more supplies flowed to Asia. U.S. LNG exports jumped to 7.60 million metric tons (MT) in May from 6.19 million MT in April and just below the 7.61 MT exported in March (Source: Reuters).
- GEOPOLITICAL TENSIONS: Fears are rising as the current tensions in the Middle East could affect liquefied natural gas shipments (LNG) to Europe. Qatar is a major supplier of LNG to the EU and the third largest LNG exporter in the world after the US and Australia.
- WEATHER FORECAST: NatGasWeather's 15-day forecast indicates the hottest weather conditions in the past 45 years (June 16th). Rising electricity demand for air conditioning could impact natural gas prices. In the summer of 2023, 46% of the electricity produced in the U.S. was generated from natural gas (source: EIA).
PRICE ACTION:
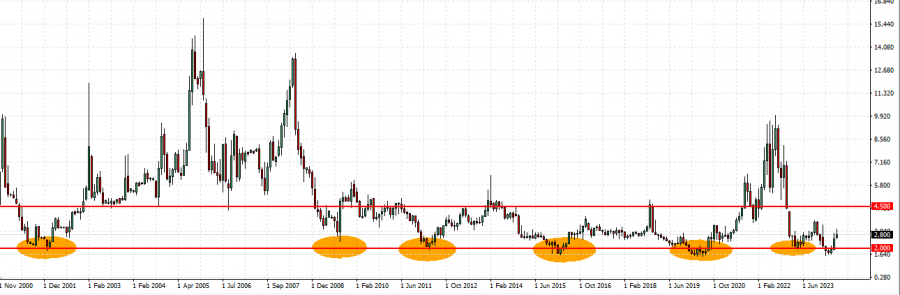
- Natural Gas has undergone a downward correction of around ~72.20% since August 23, 2022, when the price reached $10.03. Natural gas traded last around $2.79, still near the strong support at $2. If a full recovery followed, that could imply an upside of around ~259.68%. However, the price could decline further.
Since 2000 the price has fallen near or below $2 six times and within a month recovered on average 43.93%.
Source: MT4
Please note that past performance does not guarantee future results.
NATURAL GAS SEASONAL PRICE INCREASE (March -October)
The period between March and October marks an increased natural gas buying as countries across the world are refilling their storages for the next season, being accompanied by higher demand during summer months due to air conditioning. Last summer, for example, the US consumed the largest amount of electricity in its history.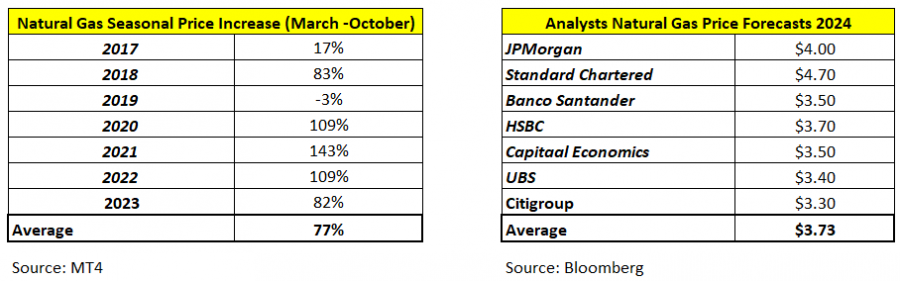
EUROPE’S natural gas capacity is 73.2% full (June 15th)(Source: Gas Infrastructure Europe (GIE) statistics). After three years of being the top supplier of LNG to Europe, the United States maintained this position in 2024, accounting for nearly 50% of the total European LNG imports.
NATURAL GAS, Jun 18, 2024
Current Price: 2.79
|
NATURAL GAS |
Weekly |
|
Trend direction |
|
|
4.500 |
|
|
3.650 |
|
|
3.150 |
|
|
2.480 |
|
|
2.100 |
|
|
1.800 |
Example of calculation based on weekly trend direction for 1 Lot1
|
Pivot Points |
||||||
|
Profit or loss in $ |
17,120.00 |
8,620.00 |
3,620.00 |
-3,080.00 |
-6,880.00 |
-9,880.00 |
|
Profit or loss in €² |
15,975.74 |
8,043.86 |
3,378.05 |
-2,874.14 |
-6,420.16 |
-9,219.64 |
|
Profit or loss in £² |
13,492.96 |
6,793.77 |
2,853.07 |
-2,427.47 |
-5,422.40 |
-7,786.82 |
|
Profit or loss in C$² |
23,537.52 |
11,851.25 |
4,976.98 |
-4,234.55 |
-9,459.00 |
-13,583.57 |
1. 1 lot is equivalent of 10,000 units
2. Calculations for exchange rate used as of 12:30 (GMT+1) 18/06/2024
- You may wish to consider closing your position in profit, even if it is lower than suggested one
- Trailing stop technique can protect the profit – Ask your Senior Account ManagerClient Manager for more detail