Natural Gas weekly special report based on 1.00 Lot Calculation:
TECHNICAL ANALYSIS:
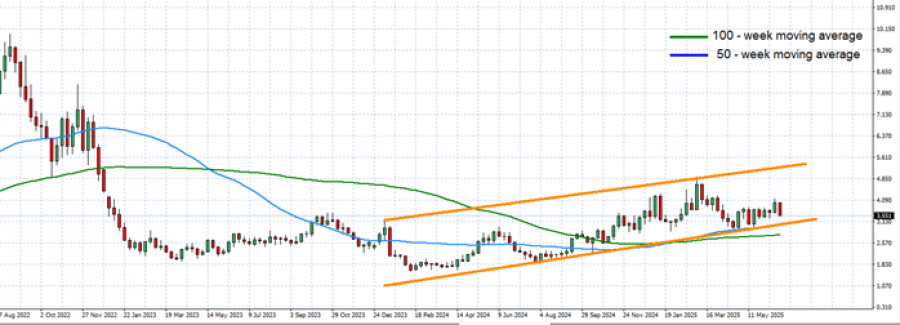
- THE 50 - WEEK MOVING AVERAGE (BLUE LINE) is gradually turning upward and currently acts as dynamic resistance, showing that momentum is cautiously improving.
- THE 100 - WEEK MOVING AVERAGE (GREEN LINE) has flattened and now acts as key support, having recently been tested multiple times—indicating a zone of strong buyer interest near the lower trendline.
- UPTREND SINCE FEBRUARY 2024: Price is forming higher lows along a rising trendline (orange), showing steady support. Price is hovering near the lower boundary of the rising channel, around $3.55, with potential for a rebound toward the upper range near $5.00, provided the trendline support holds.

GRAPH (Weekly): August 2022– June 2025
Please note that past performance does not guarantee future results
GEOPOLITICS:
- CEASEFIRE AGREEMENT BETWEEN ISRAEL AND IRAN. The de-escalation has eased immediate concerns over disruptions to LNG shipping routes through the Strait of Hormuz, a vital chokepoint for global gas flows—particularly Qatari exports. While geopolitical risk premiums have slightly receded, traders remain on edge, as the situation could shift rapidly with any renewed hostilities.
- NATO SUMMIT RENEWED FOCUS ON ENERGY SECURITY AND INFRASTRUCTURE RESILIANCE and underlined the strategic importance of LNG supply chains, reinforcing the idea that even temporary peace in the region doesn't erase long-term structural risks.
EUROPE EXPECTED TO SOON START BUYING BIG QUANTITIES OF NATURAL GAS
- EUROPEAN NATURAL GAS STORAGE REFILLING SEASON STARTS MARCH- APRIL AND ENDS IN NOVEMBER with an EU mandate requiring 90% full capacity by November. Currently, storage is at 51%, which is 19% lower than last summer.
- U.S. - A KEY LNG SUPPLIER: The U.S. provides 45% of Europe’s LNG imports, making it Europe's primary LNG source.
- 68% OF TOTAL U.S. LNG EXPORTS WENT TO EUROPE IN MAY 2024: In May, Europe accounted for around 68% of total export, importing 6.05 million tons out of a total 8.9 million. (Source: LSEG)
- STATISTICS (2016 - 2024): NATURAL GAS PRICES ROSE 47.80% ON AVERAGE DURING THE EUROPEAN REFILLING SEASON (MARCH – NOVEMBER)

Data Source: Meta Trader 4 Platform
Please note that past performance does not guarantee future results
US NATURAL GAS
- THE US EXPORTED 9.3MT A RECORD AMOUNT OF LIQUEDILED NATURAL GAS IN APRIL. The U.S. exported 8.9 million metric tons of LNG in May, second highest monthly export volume.
- AROUND 40% OF ELECTRICITY IN THE U.S. IS PRODUCED FROM NATURAL GAS: Rising consumption of electricity in the US will be accompanied by rising demand for natural gas.
- U.S.A. IS THE LARGEST EXPORTERS OF LIQUIFIED NATURAL GAS (LNG) IN THE WORLD. In total, the US exported 88.3 million tons of LNG in 2024, up 4.4% from 2023’s 84.5 million tons. (Source: EIA)
WEATHER FORECAST
- HOTTER THAN NORMAL JUNE-AUGUST PERIOD IS EXPECTED according to weather forecasts, which may drive up electricity demand for cooling, leading to an increase in natural gas consumption for power generation.
NATURAL GAS: PRICE ACTION
- NATURAL GAS PRICES HIT $9.972 IN AUGUST, 2022. Natural gas prices have risen due to Europe’s crisis and reduced Russian supply, boosting U.S. LNG demand. A rebound to $9.972 would represent a rise of approximately 180% from the current price of $3.5, though further declines cannot be ruled out.
Natural Gas, June 26, 2025
Current Price: 3.55
|
NATURAL GAS |
Weekly |
|
Trend direction |
|
|
6.0 |
|
|
5.0 |
|
|
4.0 |
|
|
3.2 |
|
|
2.9 |
|
|
2.7 |
Example of calculation based on weekly trend direction for 1.00 Lot1
|
NATURAL GAS |
||||||
|
Pivot Points |
||||||
|
Profit or loss in $ |
24,500 |
14,500 |
4,500 |
-3,500 |
-6,500 |
-8,500 |
|
Profit or loss in €² |
20,885 |
12,360 |
3,836 |
-2,984 |
-5,541 |
-7,246 |
|
Profit or loss in £² |
17,817 |
10,545 |
3,273 |
-2,545 |
-4,727 |
-6,181 |
|
Profit or loss in C$² |
33,536 |
19,848 |
6,160 |
-4,791 |
-8,897 |
-11,635 |
- 1.00 lot is equivalent of 10,000 units
- Calculations for exchange rate used as of 09:45 (GMT+1) 26/06/2025
There is a possibility to use Stop-Loss and Take-Profit.
- You may wish to consider closing your position in profit, even if it is lower than the suggested one.
- Trailing stop techniques could protect the profit.