NETFLIX (#NFLX) weekly special report based on 1 Lot Calculation:
NETFLIX: THE COMPANY
- NETFLIX is one of the world's leading streaming services, with over 300 million paid subscribers in over 190 countries. In the last 2 years, the company made a number of impactful changes and moves, like an increase in third-party licensing, a new ad plan membership, and success in cracking down on password-sharing issues.
- STOCK INDEX PARTICIPATION: Netflix stock is a part of the NASDAQ 100 (USA 100) index and S&P 500 (USA500).
NETFLIX: EVENTS
- EVENT (TUESDAY, OCTOBER 21, AFTERMARKET): Q3 EARNINGS REPORT. The company is expected to print $11.508 billion in revenue (a new record high), up around 17% from the same period last year ($9.824 billion). The company is expected to report a net income of $3.01 billion, up around 23% from the same period last year ($2.45 billion). FORWARD GUIDANCE (Q4): The company is expected to project $11.900 billion for Q4 of 2025, which would mark an increase of around 16% year on year.
- REVENUE AND EARNINGS PERFORMANCE: NETFLIX TENDS TO BEAT ESTIMATES. Over the past eight quarters, the company has beat Earnings Per Share (EPS) estimates 8 times over the past 8 quarters, while its revenue has managed to beat estimates 7 times over the past 8 quarters.
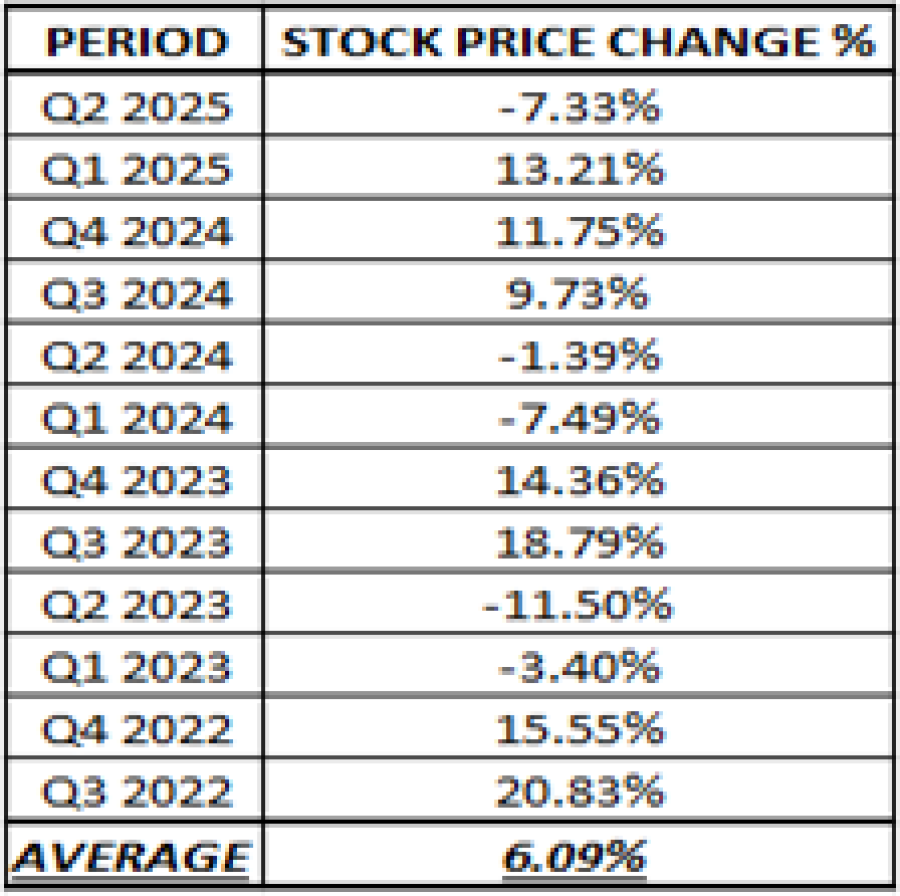
- STATISTICS (SINCE THE A.I. BOOM BEGAN IN Q3 2022): NETFLIX STOCK PRICE ROSE ON AVERAGE 6.09% WITHIN A WEEK AFTER THE QUARTERLY EARNINGS RELEASE.
Data Source: Bloomberg Terminal
Please note that past performance does not guarantee future results
NETFLIX: PRICE ACTION AND ANALYST OPINION
- NETFLIX STOCK HIT AN ALL-TIME HIGH $1,338.96 (JULY 1, 2025). The Netlix stock trades around $1,208 and it has rise around 36% since the start of 2025 and around 92% since August 2024.
- ANALYST OPINION: Rosenblatt Securities forecasts $1515; Morgan Stanley forecasts $1500; Wells Fargo forecasts $1560; Jefferies forecasts $1500; Wedbush forecasts $1500;
NETFLIX: TECHNICAL ANALYSIS
- UPTREND CHANNEL: The Netflix stock price has been maintaining its uptrend since at least August 2024, as depicted by the daily chart below. However, there remains a risk of a potential breakout below this level if market conditions change.
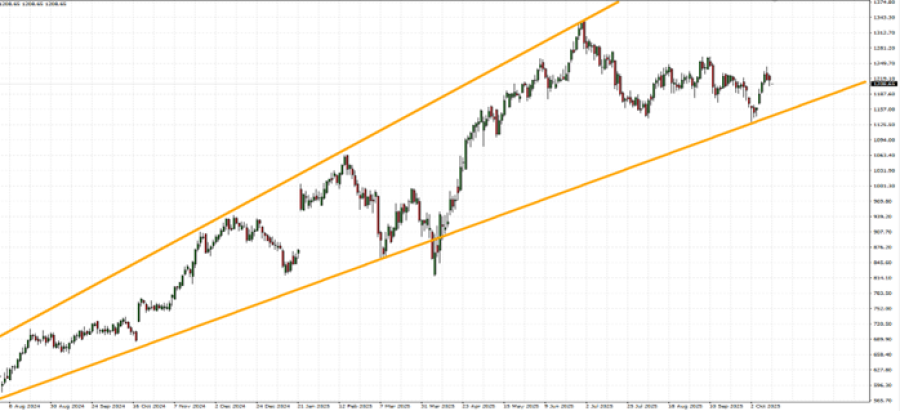
GRAPH (Daily): August 2024 – October 2025
Please note that past performance does not guarantee future results
#NFLX, October 14, 2025.
Current Price: 1208
|
NETFLIX |
Weekly |
|
Trend direction |
|
|
1560 |
|
|
1450 |
|
|
1320 |
|
|
1100 |
|
|
1070 |
|
|
1050 |
Example of calculation based on weekly trend direction for 1 Lot1
|
NETFLIX |
||||||
|
Pivot Points |
||||||
|
Profit or loss in $ |
352,000 |
242,000 |
112,000 |
-108,000 |
-138,000 |
-158,000 |
|
Profit or loss in €2 |
304,567 |
209,390 |
96,908 |
-93,447 |
-119,404 |
-136,709 |
|
Profit or loss in £2 |
265,152 |
182,292 |
84,367 |
-81,353 |
-103,952 |
-119,017 |
|
Profit or loss in C$2 |
495,018 |
340,325 |
157,506 |
-151,880 |
-194,069 |
-222,195 |
- 1.00 lot is equivalent of 1000 units
- Calculations for exchange rate used as of 10:00 (GMT+1) 14/10/2025
There is a possibility to use Stop-Loss and Take-Profit.
- You may wish to consider closing your position in profit, even if it is lower than suggested one.
- Trailing stop technique could protect the profit.