Platinum weekly special report based on 1.00 Lot Calculation:
TECHNICAL ANALYSIS:
- STRONG UPTREND SINCE LATE MARCH 2025: As shown in the daily chart below, the platinum price has had a strong rise in the last two months, confirming its mid-term trend is up (Red line support line).
- DAILY MOVING AVERAGES SIGNAL UPTREND: Platinum prices have moved above both the 50-day and 100-day moving averages, indicating a continued uptrend. However, this trend could reverse if prices drop below these key moving averages.
- RESISTANCE AND SUPPORT LEVELS: Platinum has remained in a mid-term uptrend, looking at Resistance 1 of $1450 (Resistance 2 of $1550, and Resistance 3 of $1650 to the upside. On the downside, Platinum looks at Support 1 of $1350, then towards Support 2 of $1300, and Support 3 of $1250.
- PLATINUM HIT AN ALL-TIME HIGH OF $2,300 (March 2008). Platinum currently trades around $1,390, and if a full recovery takes place, then platinum prices could see an upside of 65%. However, Platinum prices could decline, too.
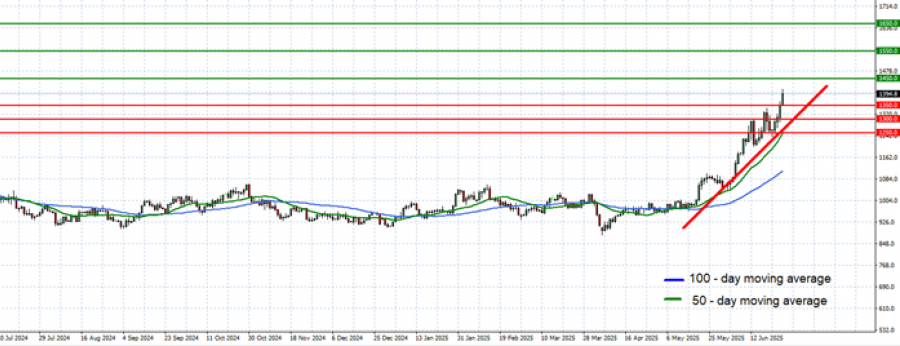
GRAPH (Daily ): July 2024 – June 2025
Please note that past performance does not guarantee future results
FUNDAMENTAL ANALYSIS:
- U.S. AND CHINA REACHED A NEW TRADE AGREEMENT. The deal eased mutual tariffs and restored rare-earth exports, signaling a thaw in economic tensions. The deal sparked optimism around China’s industrial recovery, boosting demand expectations for metals like platinum. As a result, platinum prices surged nearly 8% in a week, supported by stronger sentiment, a weaker dollar, and renewed Chinese appetite for industrial inputs.
- PLATINUM IMPORTS IN CHINA IN APRIL HIT 11.5 METRIC TONS — THE HIGHEST MONTHLY VOLUME IN A YEAR. Chinese jewelers are increasing platinum imports as high gold prices dampen gold jewelry sales. Even a 1% shift from gold to platinum jewelry could double the supply deficit to 1.6M oz (Source: BofA).
- THE WORLD PLATINUM INVESTMENT COUNCIL (WPIC) PROJECTS A SUPPLY DEFICIT OF NEARLY 1 MILLION OUNCES IN 2025 driven by strong demand and constrained output.
EVENTS (USA):
- FRIDAY, JUNE 27 AT 13:30 GMT+1: CORE PCE PRICE INDEX (MAY): Weaker-than-expected core PCE data—considered the Fed’s key inflation indicator—tends to weaken the U.S. dollar by reducing the likelihood of further rate hikes. A softer dollar supports platinum prices. On the other hand, stronger core PCE readings can lift the dollar and weigh on platinum.
- FRIDAY, JULY 3 AT 13:30 GMT+1: NONFARM PAYROLLS AND UNEMPLOYMENT RATE (JUN). Weaker-than-expected labor market data, such as a rising unemployment rate and lower non-farm payroll (NFP) figures, typically put downward pressure on the U.S. dollar by decreasing the chances of additional interest rate hikes. A weaker dollar, in turn, tends to support platinum prices. On the other hand, stronger labor market readings can lift the dollar and weight on platinum prices.
Platinum, June 26, 2025
Current Price: 1,390.00
|
PLATINUM |
Weekly |
|
Trend direction |
|
|
1,650.0 |
|
|
1,550.0 |
|
|
1,450.0 |
|
|
1,350.0 |
|
|
1,300.0 |
|
|
1,250.0 |
Example of calculation based on weekly trend direction for 1.00 Lot1
|
PLATINUM |
||||||
|
Pivot Points |
||||||
|
Profit or loss in $ |
26,000 |
16,000 |
6,000 |
-4,000 |
-9,000 |
-14,000 |
|
Profit or loss in €² |
22,186 |
13,653 |
5,120 |
-3,413 |
-7,680 |
-11,946 |
|
Profit or loss in £² |
18,919 |
11,642 |
4,366 |
-2,911 |
-6,549 |
-10,187 |
|
Profit or loss in C$² |
35,585 |
21,898 |
8,212 |
-5,475 |
-12,318 |
-19,161 |
- 1.00 lot is equivalent of 100 units
- Calculations for exchange rate used as of 11:30 (GMT+1) 26/06/2025
There is a possibility to use Stop-Loss and Take-Profit.
- You may wish to consider closing your position in profit, even if it is lower than the suggested one.
- Trailing stop techniques could protect the profit.